If you have been following our Facebook, Twitter and Instagram feeds every week you have been seeing a marked improvement over the amount of real estate that has been sold in Waterloo Region. The statistics don’t lie – more homes have been sold at higher prices in the second quarter compared to the first.
After a busy spring real estate market in Waterloo Region, we have compiled residential real estate statistics for both Kitchener-Waterloo and Cambridge, Ontario.
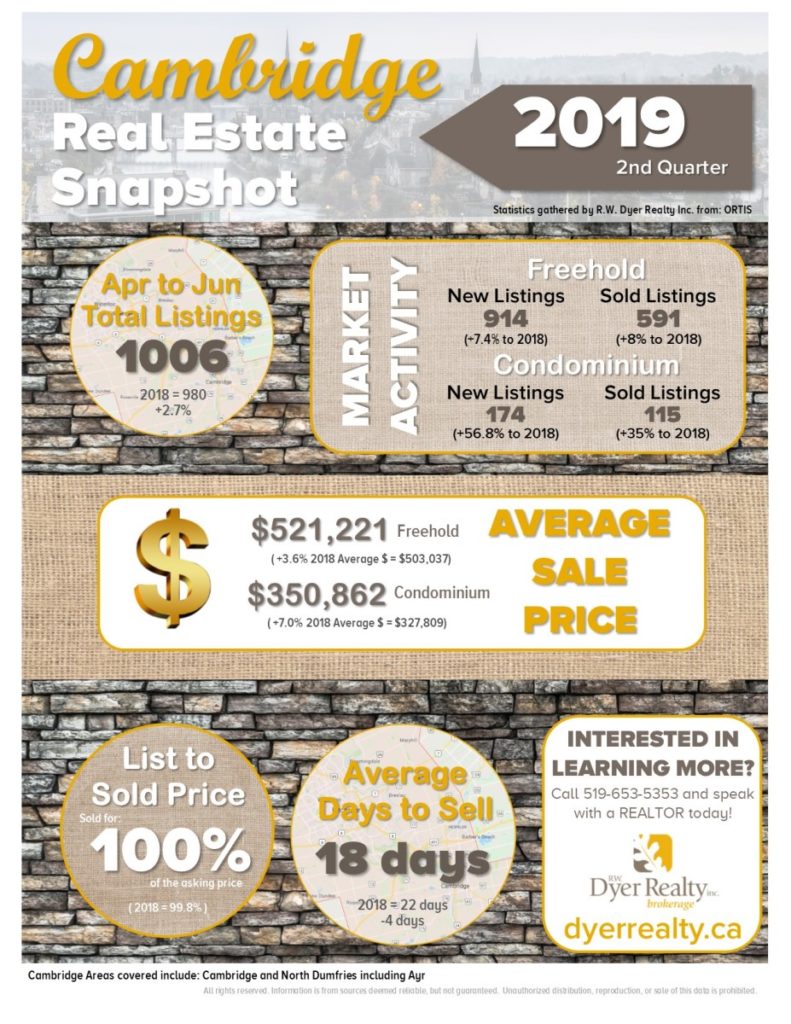
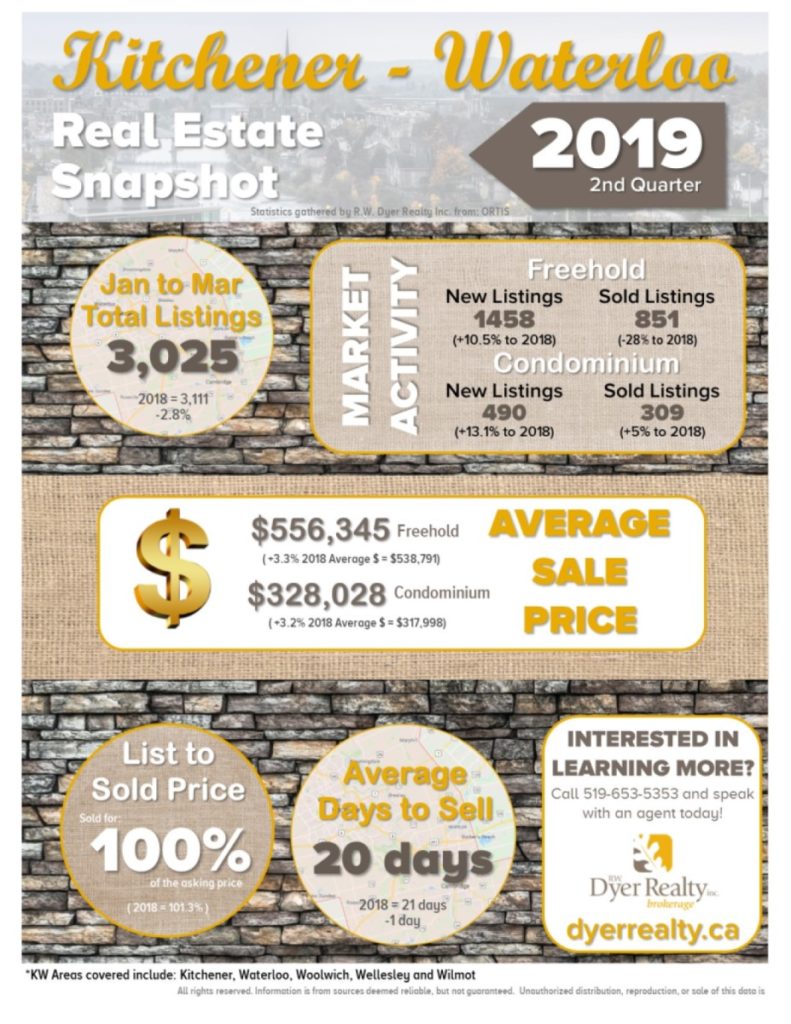
In the infographics below, you will find statistics relating to number of new listings, number of sales, average sales prices and number of days to sell. We have also provided list to sold price ratios and the total number of properties listed.
The statistics have been compiled with help from the Cambridge Association of REALTORS®.
Cambridge 2nd Quarter Snapshot

Kitchener-Waterloo 2nd Quarter Snapshot

The Statistics Explained
Across Waterloo Region the second quarter has brought an increase in the number of both freehold and condominium listings. Residential properties are selling for an average of 100% of the listing price, indicating a persistent Seller’s market.
Despite an increase in listings, Kitchener-Waterloo has seen a 28% year-over-year decrease in the number of freehold homes sold in the second quarter. Condominium sales in K-W are up 5% however, compared to the same period in 2018. Average sale prices have increased a little over 3% across the board and properties are taking an average of 20 days to sell in Kitchener-Waterloo.
Cambridge has experienced an increase in both the number of freehold (+8%) and condominium (+35%) sales in the second quarter of 2019. Prices are also up in Cambridge, with freehold properties increasing 3.6% and condos 7% over last year. Between April and June, homes in Cambridge took an average of just 18 days to sell.
