
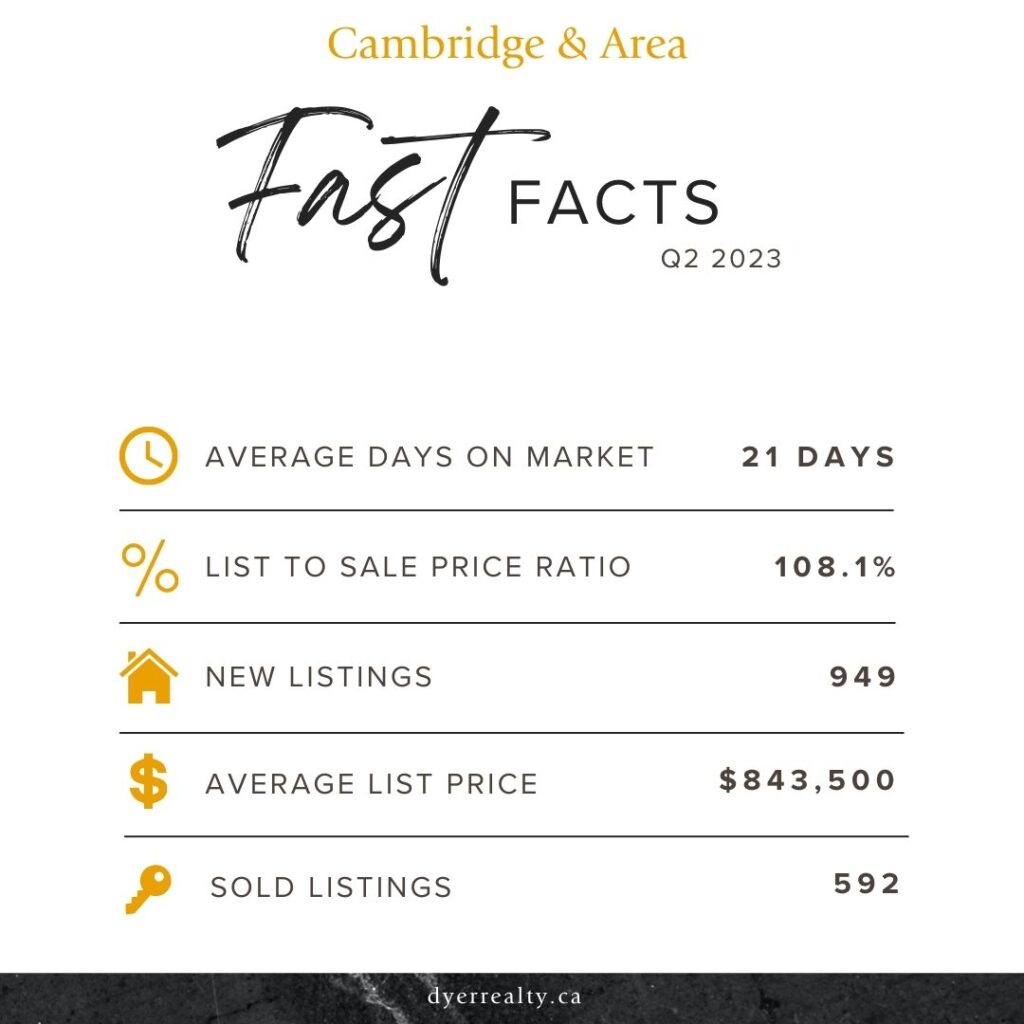
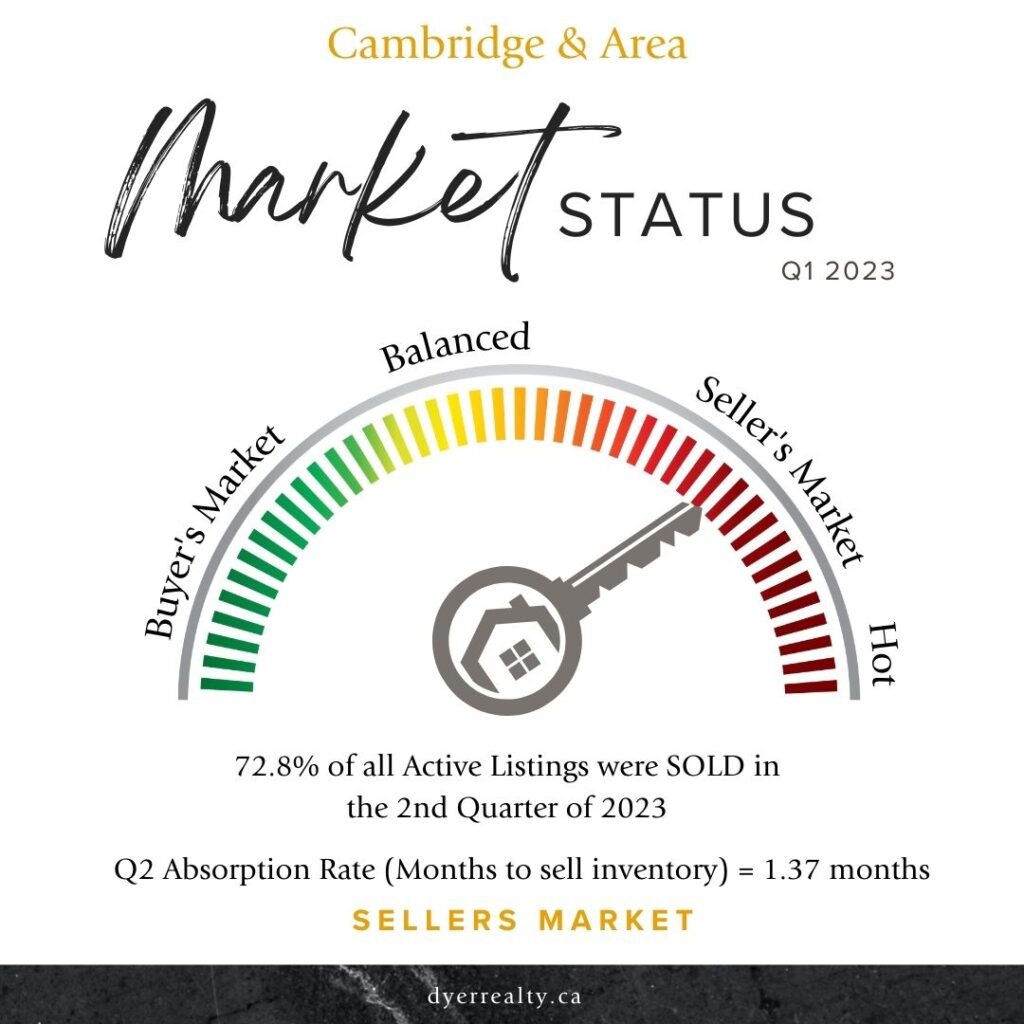
Cambridge real estate statistics remained in a solid Seller’s Market for the second quarter of 2023, with MLS sale price exceeding the asking price by 8.1% on average. Prices for all homes types (detached, attached and apartment condominiums) were up from the first quarter of 2023 but down from the same period last year.
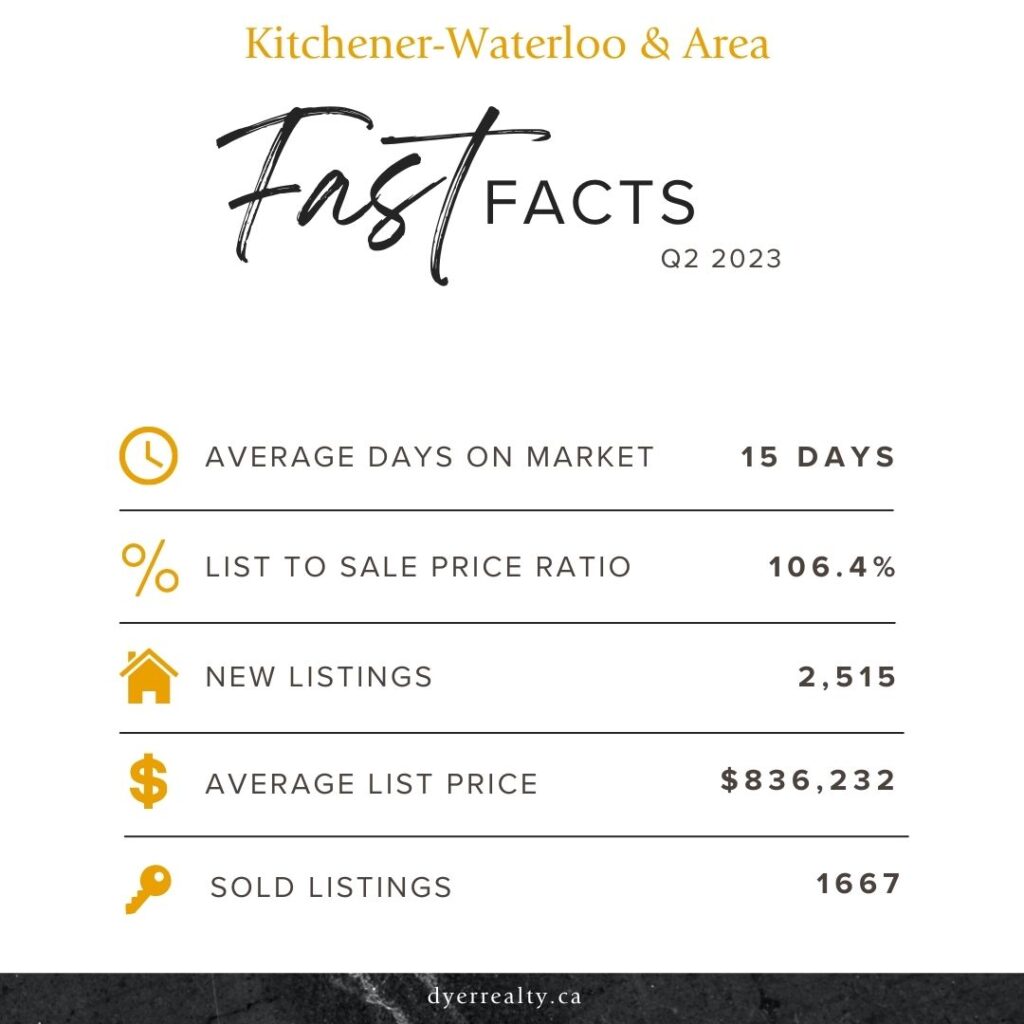
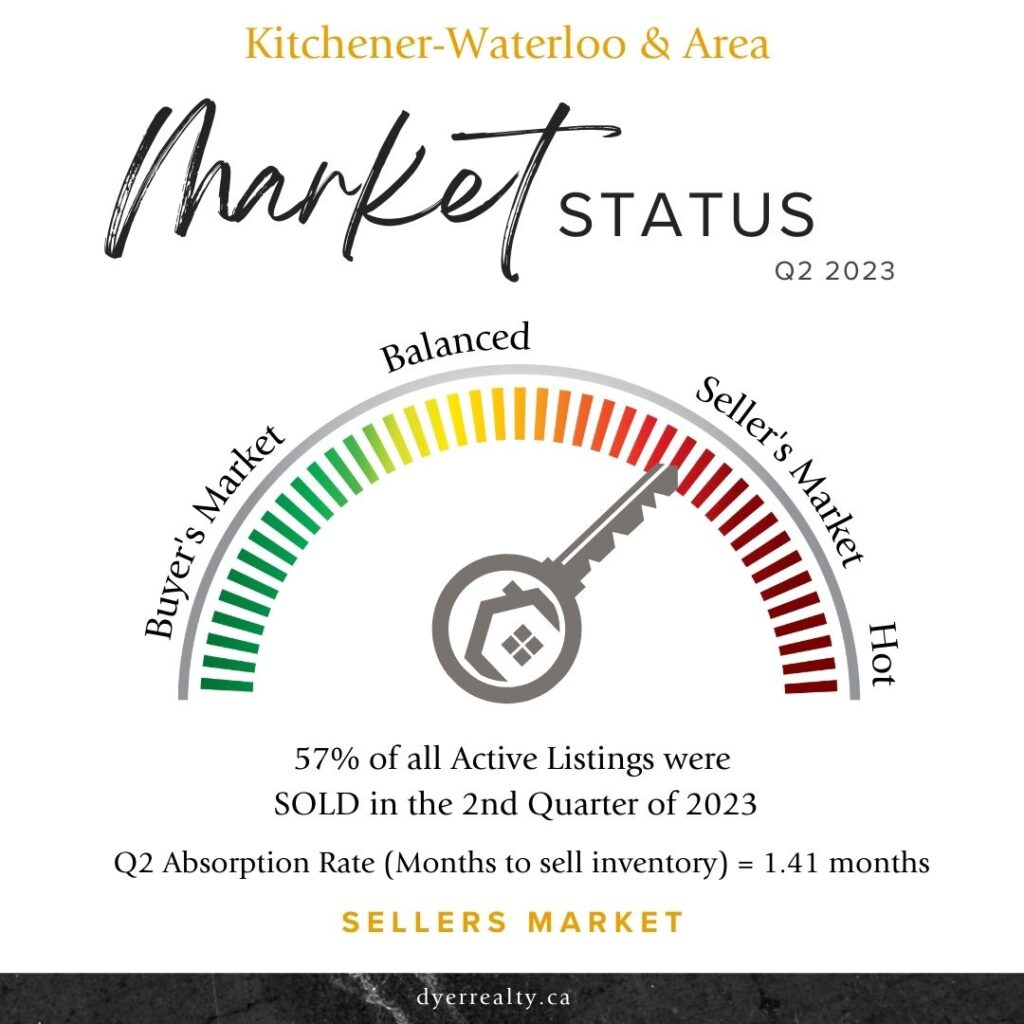
Kitchener-Waterloo experienced similar trends with MLS sale prices surpassing list prices by 6.4% in the second quarter. Across the board, prices are up from the first quarter of 2023 but down from the year prior for all home styles.
Strong demand and limited listing inventories are counteracting increased mortgage rates in 2023, propping up a market that would otherwise be negatively affected by higher carrying costs. The number of active MLS listing are down year-over-year and remain near historically low levels (seasonally adjusted) in both Cambridge and Kitchener-Waterloo.
In summary, a market sending mixed messages. Although no clear short-term trends are evident, in the long-term, real estate purchased prudently and financed conservatively, will always remain a safe and stable investment.
–
Q2 – Real Estate Statistics – The Fast Facts
In these graphics we compare fast real estate statistics for Cambridge as well as Kitchener-Waterloo for the second quarter of 2023.
Note: The Cambridge area includes North Dumfries and Ayr. The Kitchener-Waterloo area includes Wilmot and Wellesley.
–
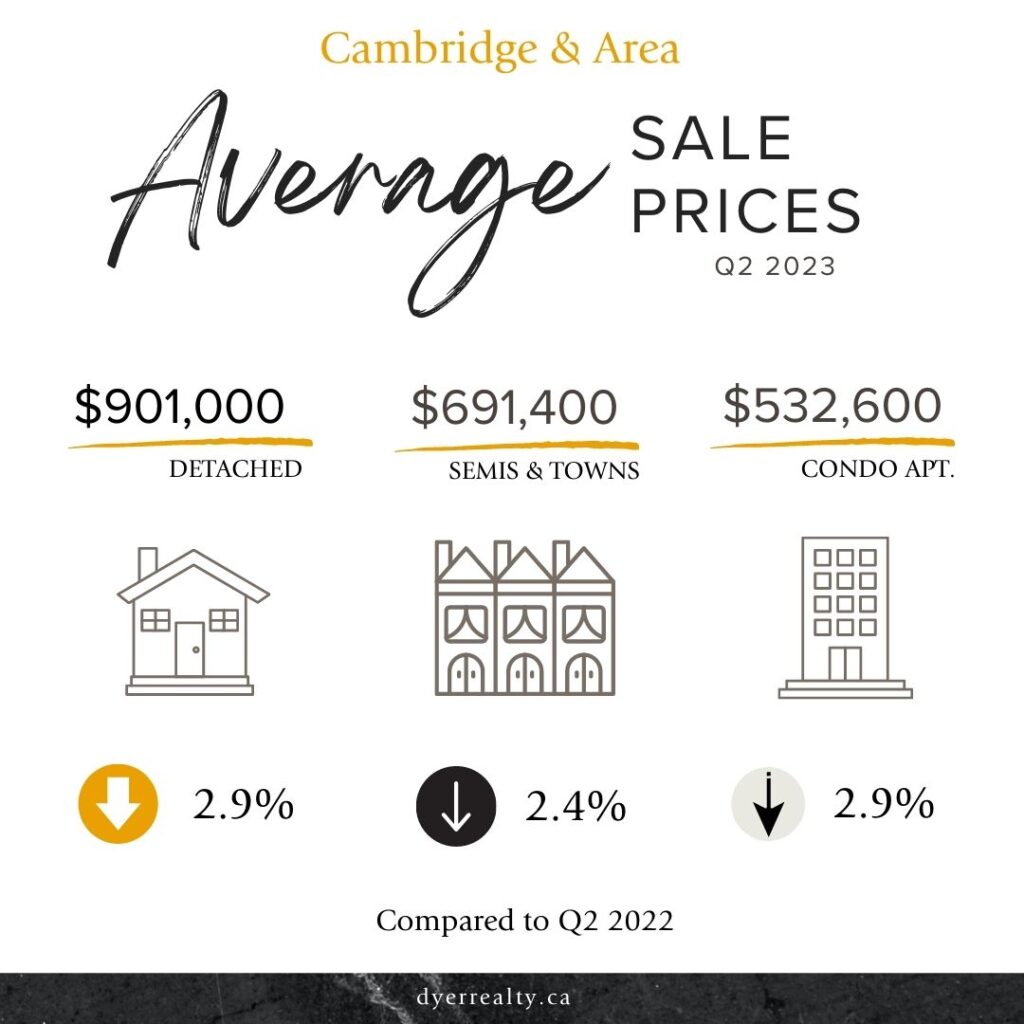
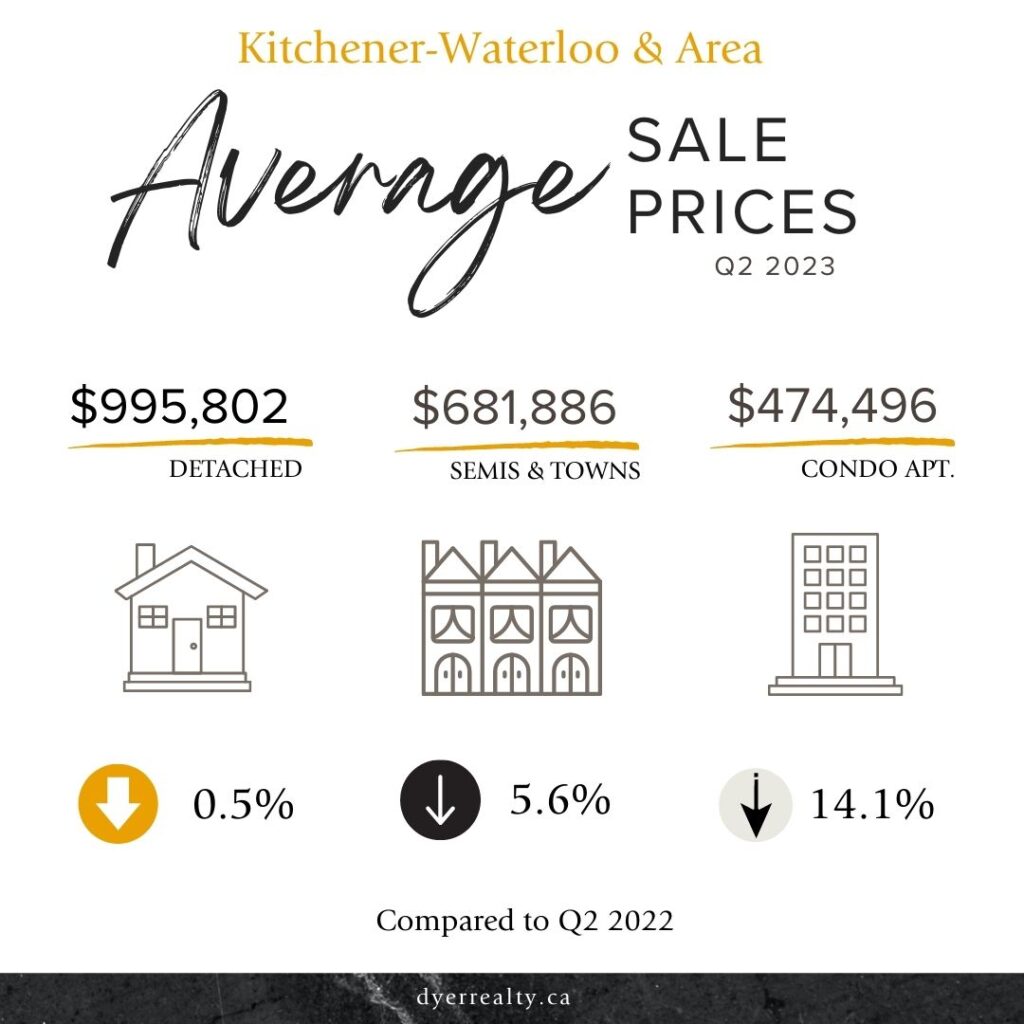
Q2 – Real Estate Statistics – Average Sale Prices
We can always expect to see average sale prices vary depending on the type of property and location.
Kitchener-Waterloo came out on top as far as average real estate price for detached homes in the second quarter of 2023. Cambridge’s Semis, Towns and Condos sold for higher prices than their K-W counterparts.
It should be noted that average sale prices for the entire region were lower than they were for the second quarter of 2022.
–
Q2 – Real Estate Statistics – Market Status
Waterloo Region sat firmly in a sellers residential real estate market at the end of the 2nd quarter. This was determined by comparing the number of sales versus the number of active listings.
–
Interested in learning more about real estate around you?
Thinking of making a move? We know that city-wide real estate statistics do not always translate to what is happening in your neighbourhood or on your street. One of our sales representatives would be happy to crunch the numbers in our area and help you understand your home value. Give us a call at 519-653-5353 today!
And be sure to tune into our social media channels for weekly updates on real estate statistics every Friday through our Facebook, Twitter and Instagram pages.
Statistics have been compiled by R.W. Dyer Realty Inc., Brokerage through the Waterloo Region Association of REALTORS® Multiple Listing Service (MLS).