
The real estate statistics in Waterloo Region continued on the same path in the 4th quarter of 2023. Kitchener-Waterloo and Cambridge ended 2023 with a balanced market but what does this actually mean for buyer’s and sellers?
- Balanced Market: When the number of homes for sale is roughly equal to the number of buyers, it’s a balanced market. Prices are stable, and neither buyers nor sellers have a significant advantage.
- Buyer’s Market: This happens when there are more houses for sale than there are buyers. Buyers have more options, so sellers may need to lower prices or offer incentives to attract buyers.
- Seller’s Market: This occurs when there are more buyers than available houses. Sellers have the upper hand, often receiving multiple offers and being able to set higher prices.
For your comparison, statistics for the rest of 2023 are linked here:
- 2023 – 3rd Quarter Real Estate Review
- 2023 – 2nd Quarter Real Estate Review
- 2023 – 1st Quarter Real Estate Review
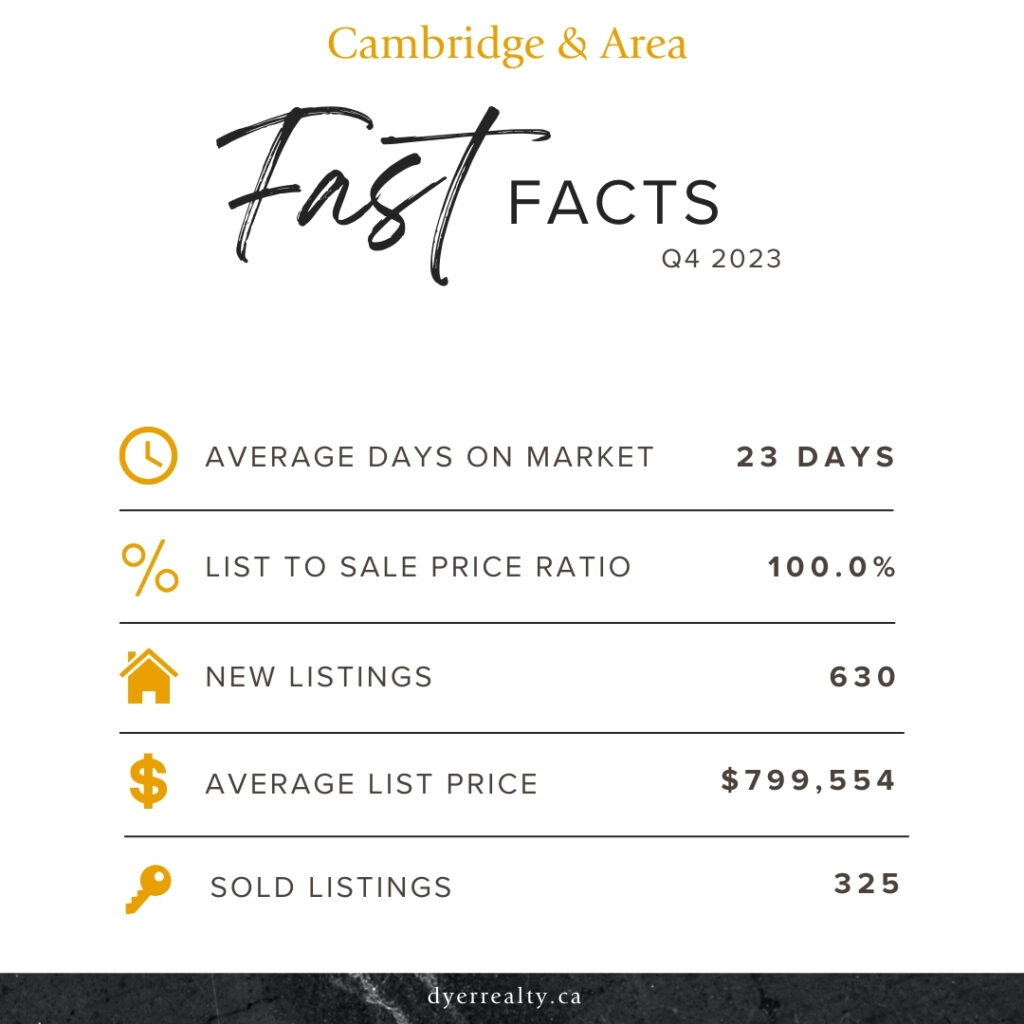
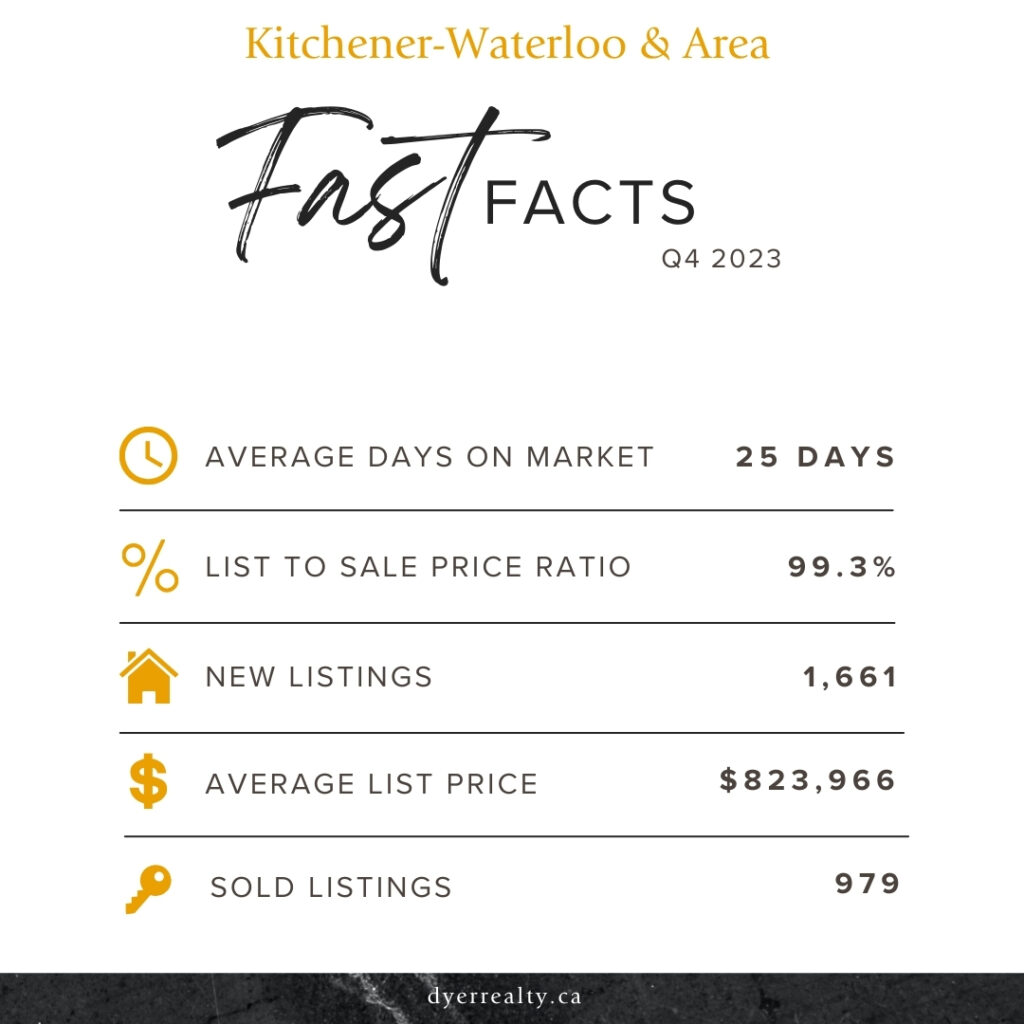
Q4 – Real Estate Statistics – The Fast Facts
In these graphics we compare fast real estate statistics for Cambridge as well as Kitchener-Waterloo for the fourth quarter of 2023.
Cambridge area homes sold faster and closer to the asking price than Kitchener-Waterloo homes this quarter. Average list prices in Kitchener-Waterloo were higher however.
Note: The Cambridge area includes North Dumfries and Ayr. The Kitchener-Waterloo area includes Wilmot and Wellesley.
–
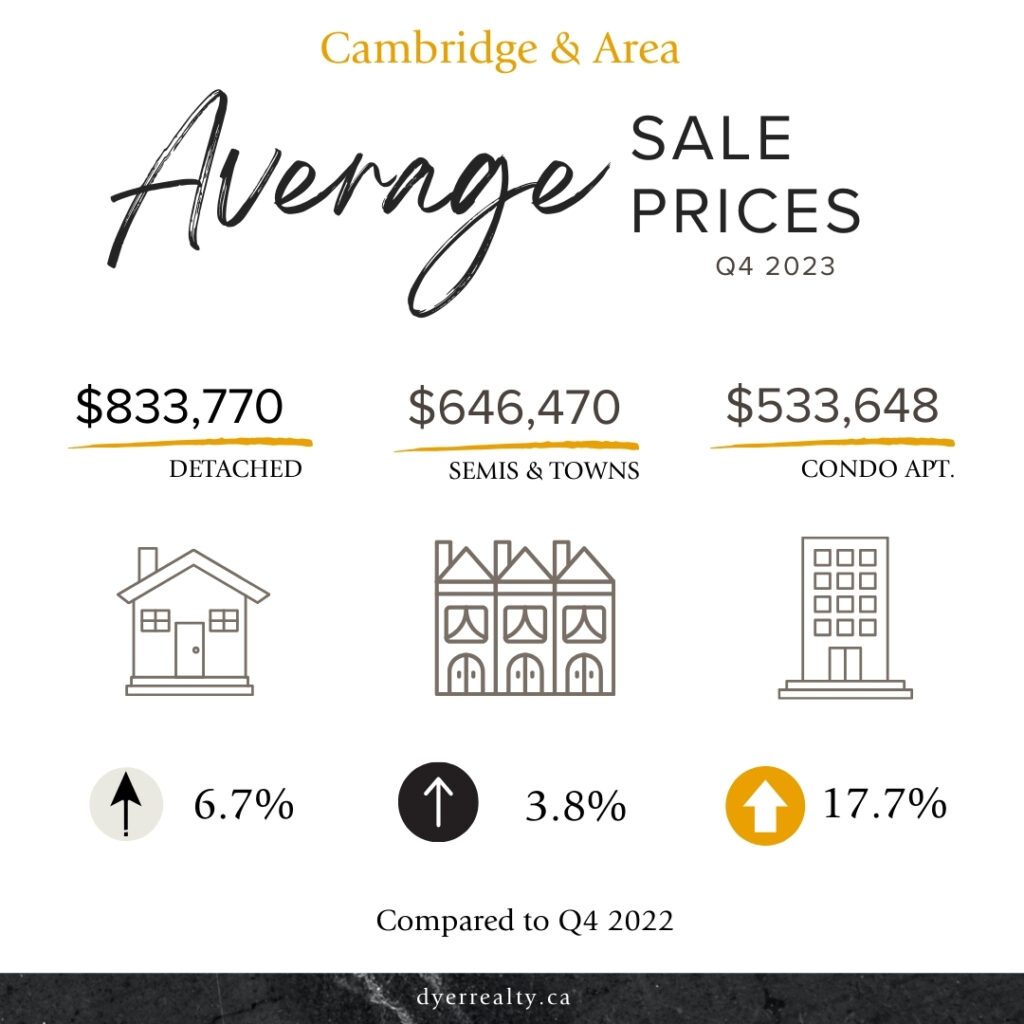
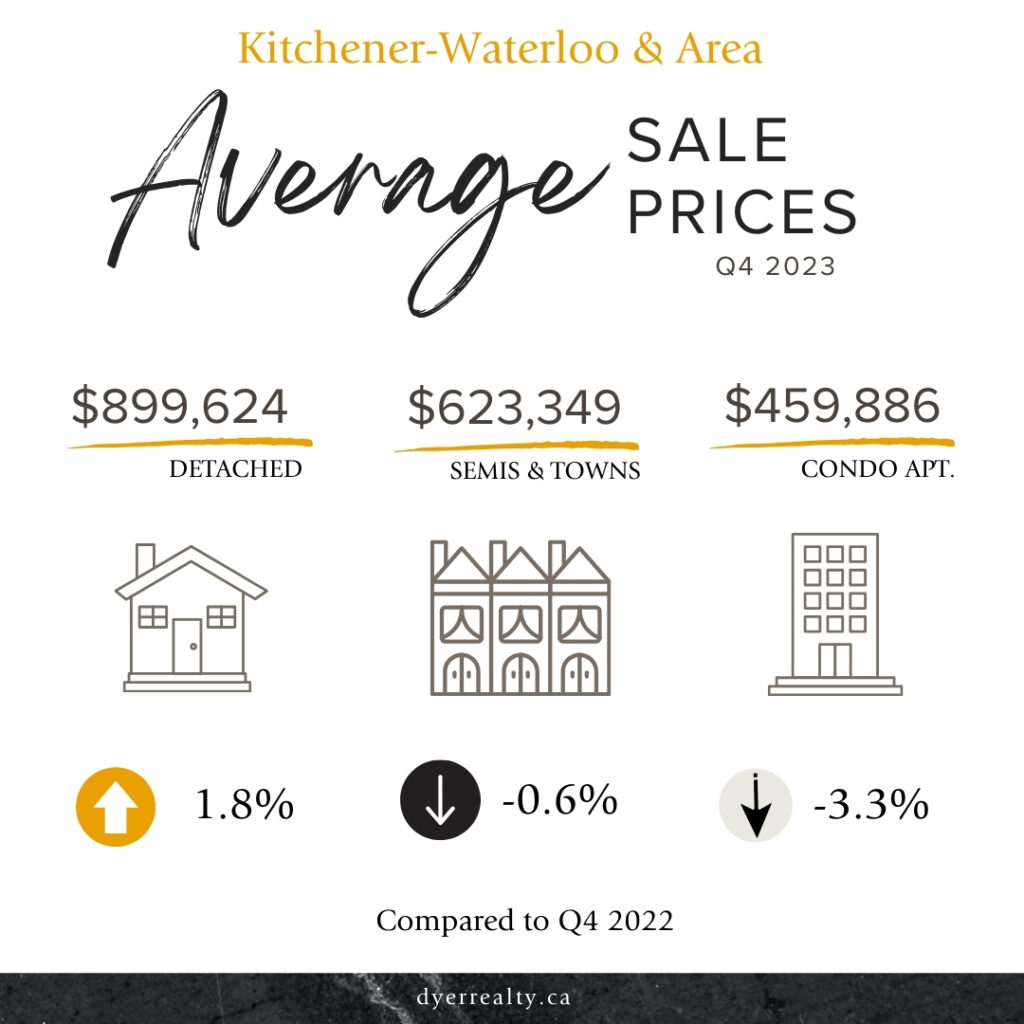
Q4 – Real Estate Statistics – Average Sale Prices
Sale price statistics for detached homes in Kitchener-Waterloo came out higher on average than the same period in 2022. However, semis & townhouses as well as condo apartments in the same area were all lower than last year.
Cambridge properties fared much better, with all types of properties selling for more than the prior year. Considering list prices were higher in K-W, it should not be surprising to see the average detached property selling for a lower dollar amount.
–
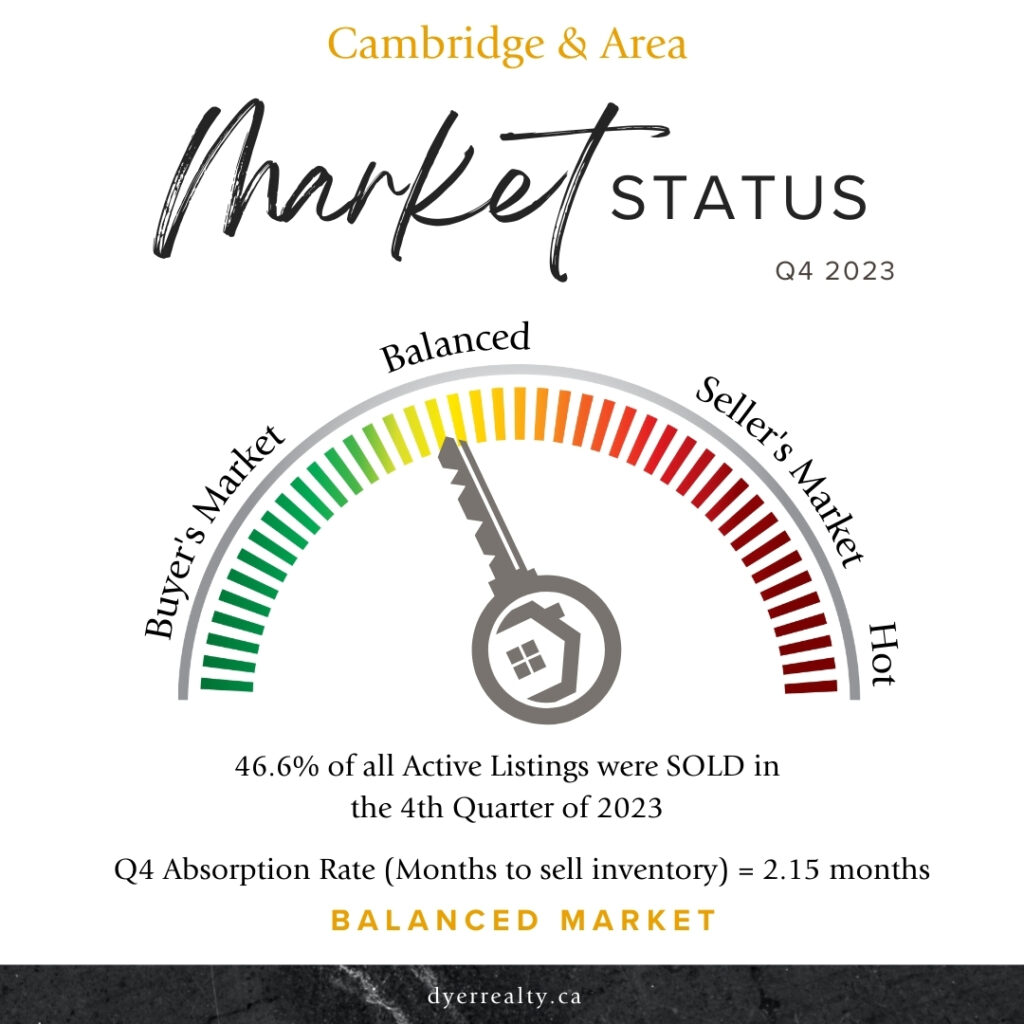
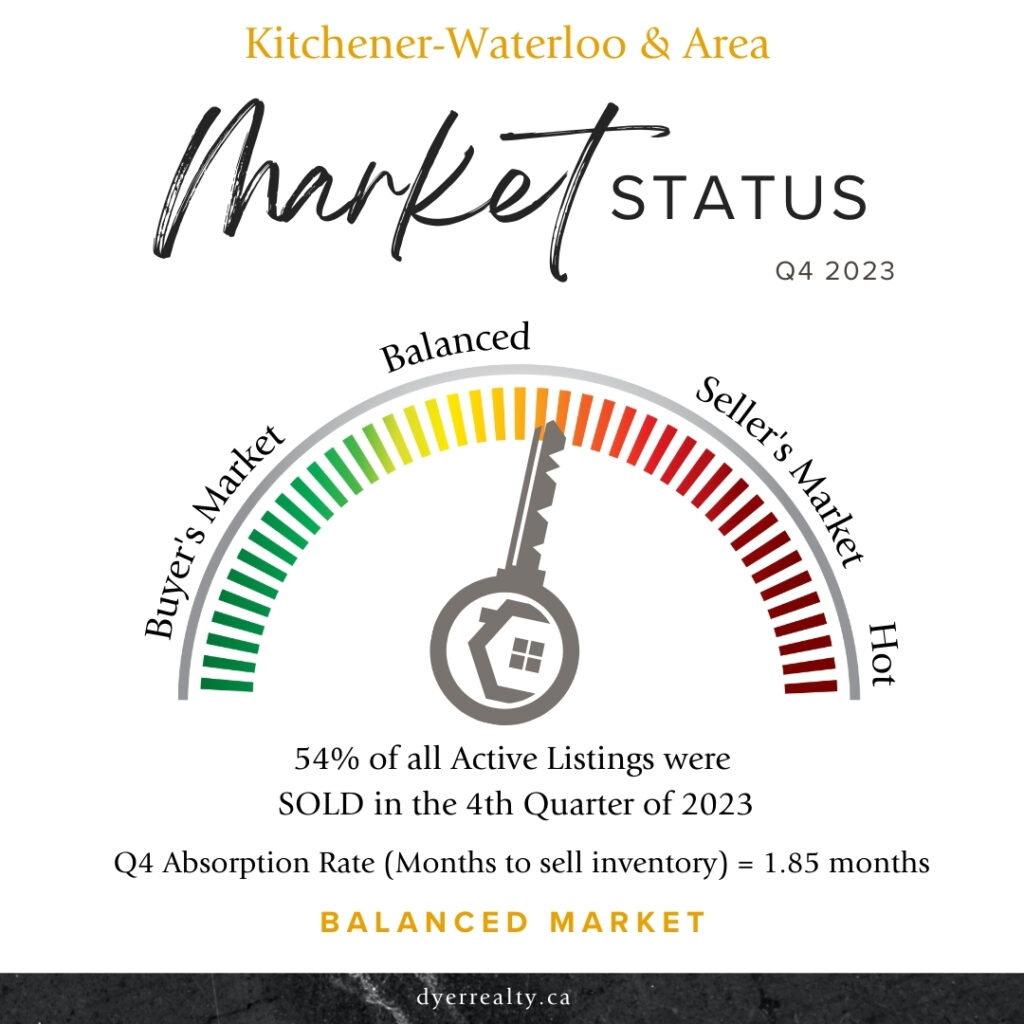
Q4 – Real Estate Statistics – Market Status
All of Waterloo Region found the real estate market to be balanced at the end of the 4th quarter. With slightly less inventory compared to sales, Kitchener-Waterloo and area real estate statistics placed them on the cusp of a Seller’s Market which could be exciting for those looking to sell this winter. Cambridge and area was firmly balanced with 2.15 months of inventory to start the new year.
–
Want to learn what the real estate market is like in your neighbourhood?
We know that city-wide real estate statistics do not always translate to what is happening on your street or even in your neighbourhood. One of our sales representatives would be happy to crunch the numbers in your area and help you understand your home value. Give us a call at 519-653-5353 today!
And be sure to tune into our social media channels for weekly updates on real estate statistics every Friday through our Facebook, Twitter and Instagram pages.
Statistics have been compiled by R.W. Dyer Realty Inc., Brokerage through the Waterloo Region Association of REALTORS® Multiple Listing Service (MLS).