With the 1st quarter of 2021 under our belts, the real estate market in south-western Ontario is on fire. Real Estate statistics compiled through the Cambridge Association of REALTORS® MLS indicate homes are selling for more than ever and in record time.
On top of the weekly updates that are shared on our Facebook, Twitter and Instagram accounts, we’ve put together the infographics below to show 1st quarter statistics by geographic area including Cambridge, Kitchener-Waterloo, Brantford and Woodstock.
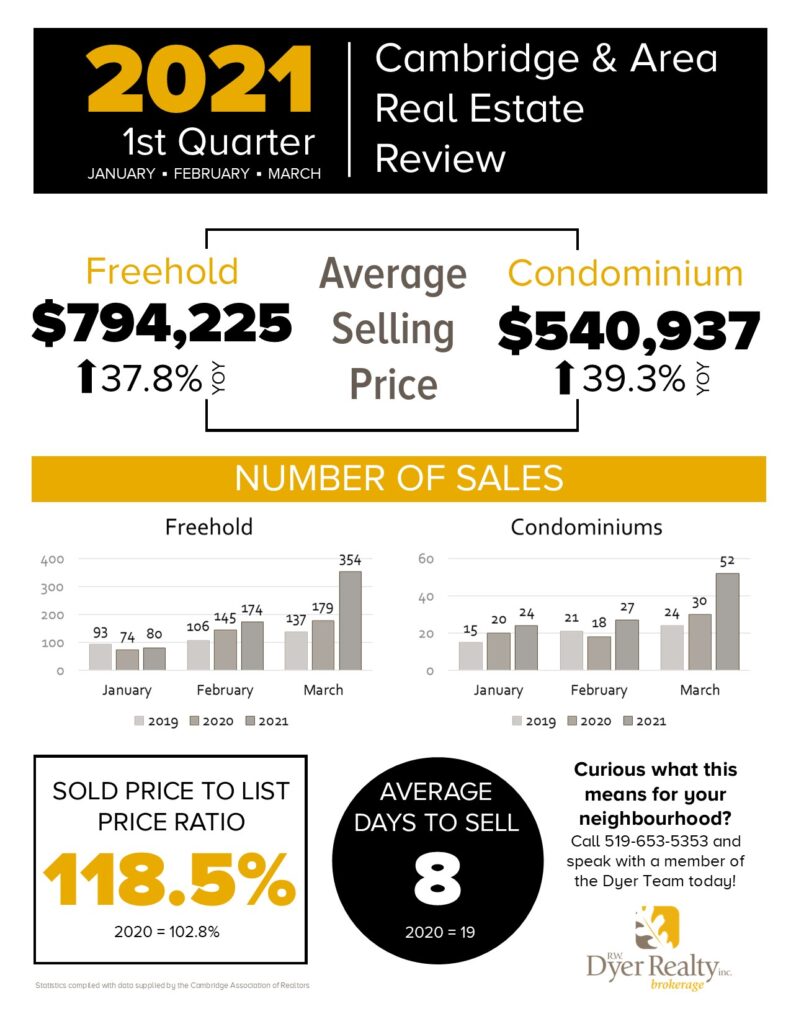
Cambridge 1st Quarter Statistics

Note: Cambridge sales statistics include areas within the City of Cambridge as well as North Dumfries and Ayr.
Compare Statistics to 2020-4th Quarter Real Estate Review for Cambridge.
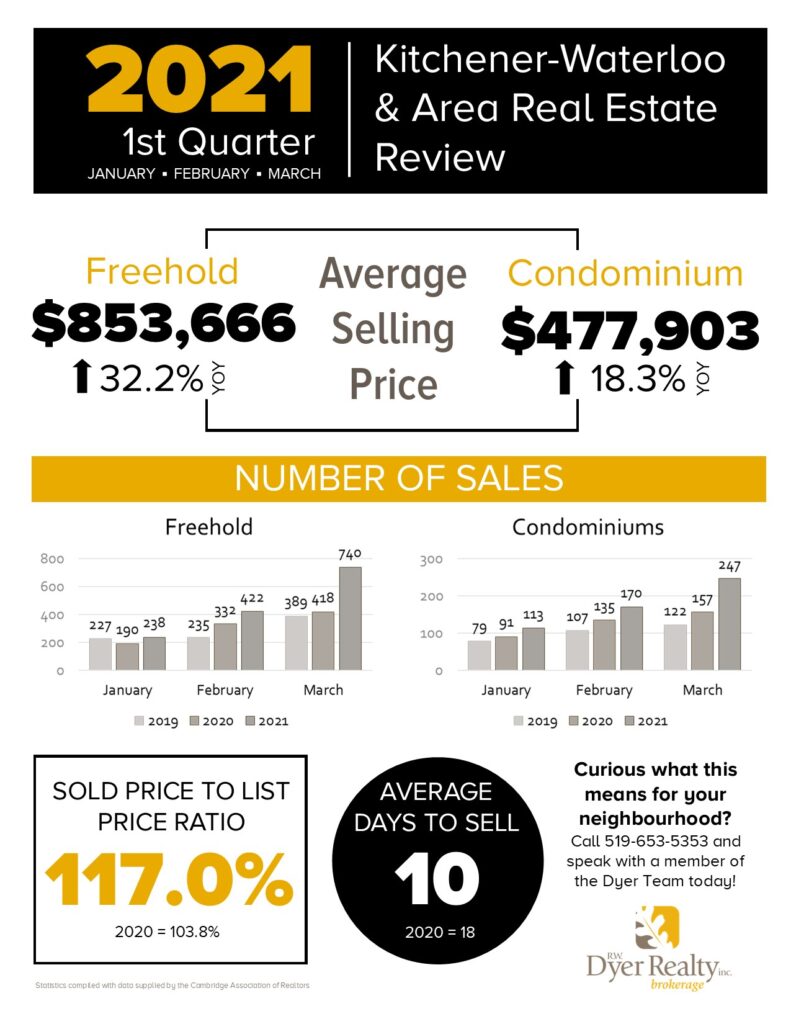
Kitchener-Waterloo 1st Quarter Sales Statistics

Note: Kitchener-Waterloo sales statistics include data from Kitchener, Waterloo, Woolwich, Wellesley and Wilmot.
Compare Statistics to 2020-4th Quarter Real Estate Review for K-W.
Brantford & Area 1st Quarter Sales Statistics

Note: Brantford sales statistics include areas within the City of Brantford as well as the County of Brant including Paris.
Compare Statistics to 2020-4th Quarter Real Estate Review for Brantford/Brant.
Woodstock 1st Quarter Sales Statistics

Compare Statistics to 2020-4th Quarter Real Estate Review for Woodstock.
What does this mean for your area?
It is true that city-wide market stats do not always directly translate to what may be happening in your neighbourhood or even on your street. That is why we strongly recommend that you contact one of our sales representatives to help you understand your specific home value.
The R.W. Dyer Realty team has over 40 years experience working with buyers and sellers helping them make informed decisions regarding real estate. If you are thinking of making a move, we would be happy to crunch the numbers in your area. Give us a call at 519-653-5353 today!
