It’s been a wild ride for real estate this past year! With open houses cancelled and pandemic lockdowns during the 2nd quarter of 2020, it is not surprising to see a change in real estate statistics for the second quarter of 2021
Thanks to help from the Cambridge Association of REALTORS® Multiple Listings System, the team here at R.W. Dyer Realty has been able to compare and contrast real estate statistics in our local area.

Kitchener-Waterloo and Area
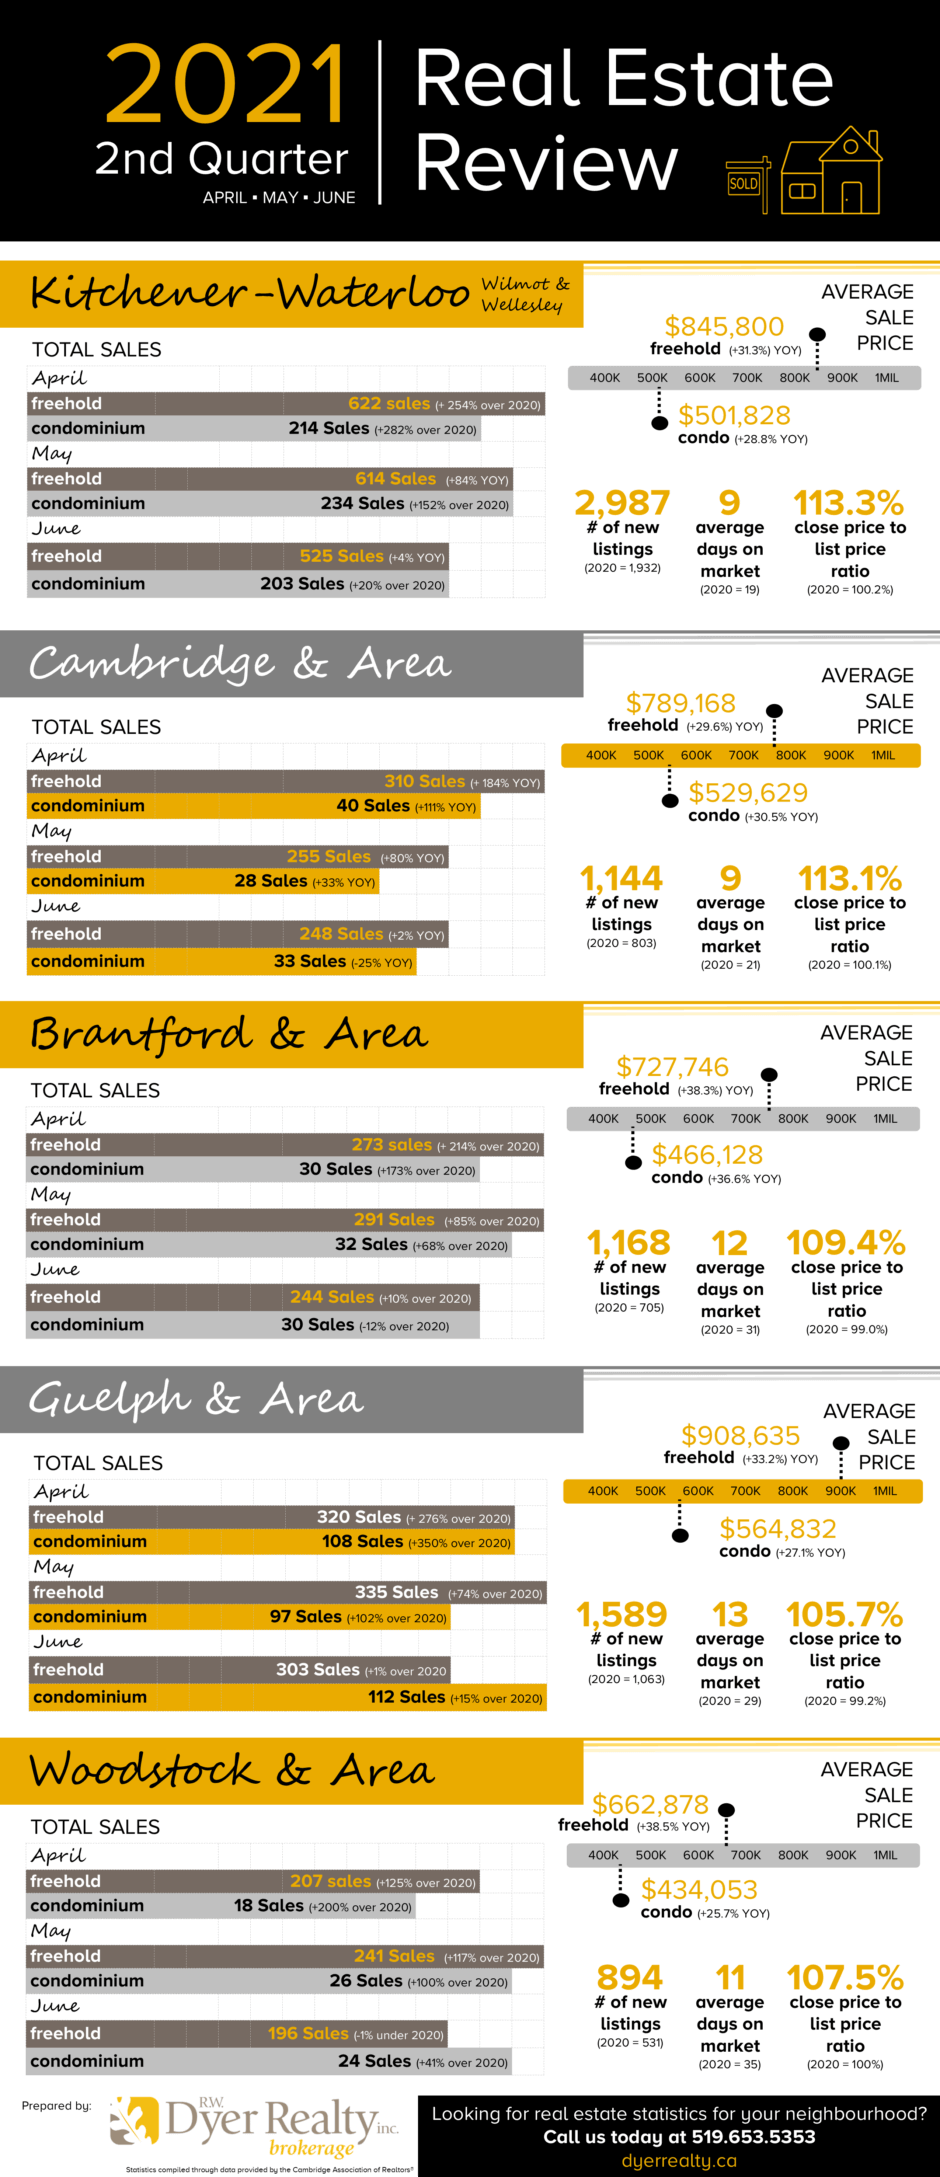
Real estate statistics in the Kitchener-Waterloo area had the highest number of new listings and the highest number of sales with the average home selling in only 9 days. Prices are up compared to last year and most homes sold for 13.3% higher than the asking price.
Cambridge and Area
The Cambridge real estate statistics are similar to Kitchener-Waterloo with regards to the average days to sell a property and the close to list price ratio, however the number of sales in the hot market of April and May did start to cool in June.
Brantford and Area
The real estate statistics in the Brantford area saw some significant increases in both the average sale price and the number of sold properties in the second quarter of 2021. Homes took slightly longer to sell in this area compared to others however the close price to list price ratio was strong at 9.4% higher than the listing price.
Guelph and Area
The Guelph area saw the highest average sales prices in the area with the average freehold home hitting an all-time high of $908,635. Freehold sales statistics were strong in April and May but flattened out to the same as last year for June. The number of condo sales were up over last year for the entire second quarter, with a peak in April of a 108 sales. On average, Guelph properties sold for 5.7% over the asking price and in 13 days.
Woodstock and Area
Being just that much further than the GTA, real estate in the Woodstock area traditionally has lower statistics compared to it’s counterparts. However there has been a marked increase in the average prices for freehold and condo properties this past quarter. Sales numbers have increased across the board and the average home was sold in the area for 7.5% higher than the asking price.
Looking for more statistics?
Updates are shared on our Facebook, Twitter and Instagram accounts every Friday to cover what has been happening in Waterloo Region real estate over the past 7 days. Here you can find the number of new listings have come to the market, how many properties have sold, what the average sale price was and how many days it took to sell.
On top of the weekly and quarterly update, the team at R.W. Dyer Realty would love to help you understand how real estate is selling in your specific area and for your style of home. Reach out to your favourite sales representative or give us a call at 519.653.5353 and ask to speak with a REALTOR today!
