
The first quarter of 2023 ushered in an improving Seller’s Market in Waterloo Region buoyed by newly stabilized interest rates and pent-up demand from home buyers.
Although prices are still down across the board for all housing types, thanks to continued low MLS inventories and strong demand from buyers, it appears a strong spring market lies ahead.
Note: Cambridge statistics include the communities within North Dumfries including Ayr. Kitchener-Waterloo statistics also include the areas of Woolwich, Wellesley and Wilmot.
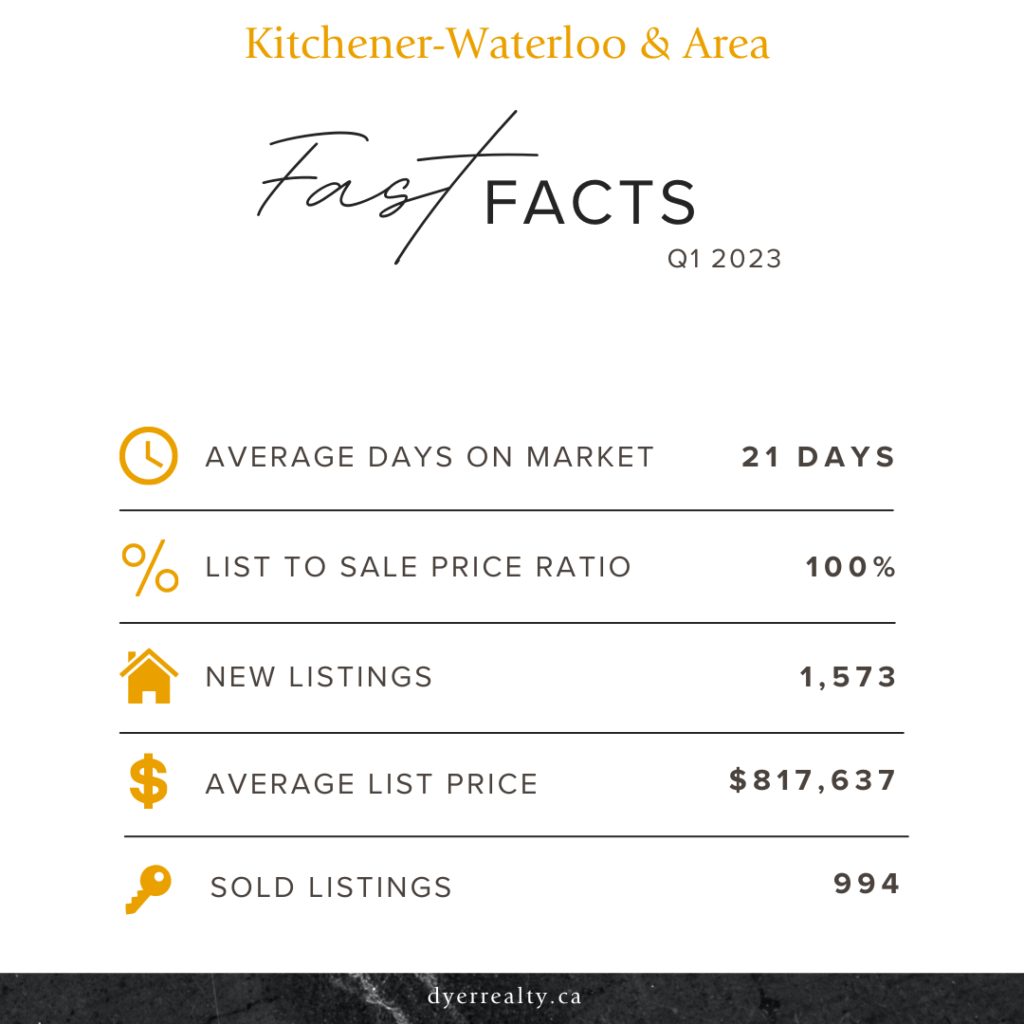
Q1 – Fast Real Estate Facts
Statistics across Waterloo Region were very similar when reviewing the fast facts. On average, homes sold within 21 days on the market and for 100% of their listing price. The average listing price in the Kitchener-Waterloo area was higher than it was in Cambridge however.

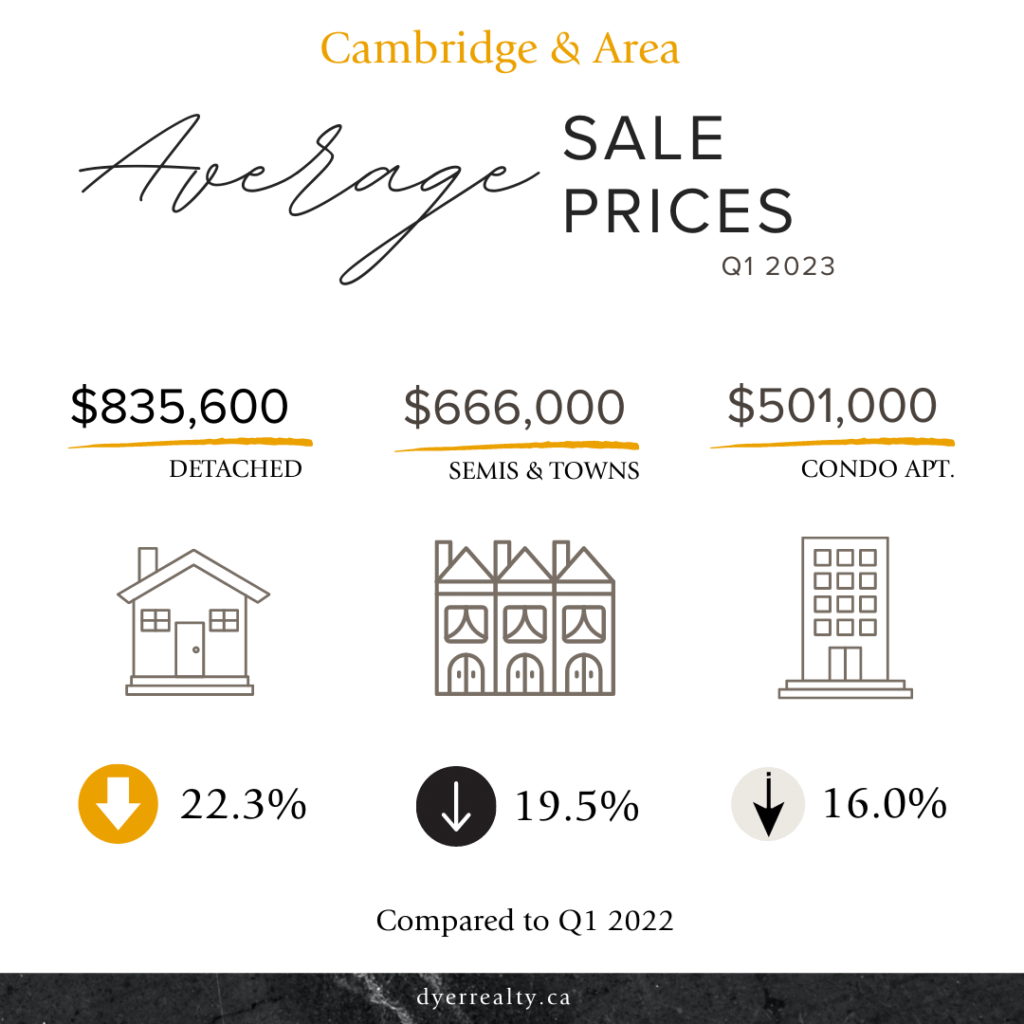
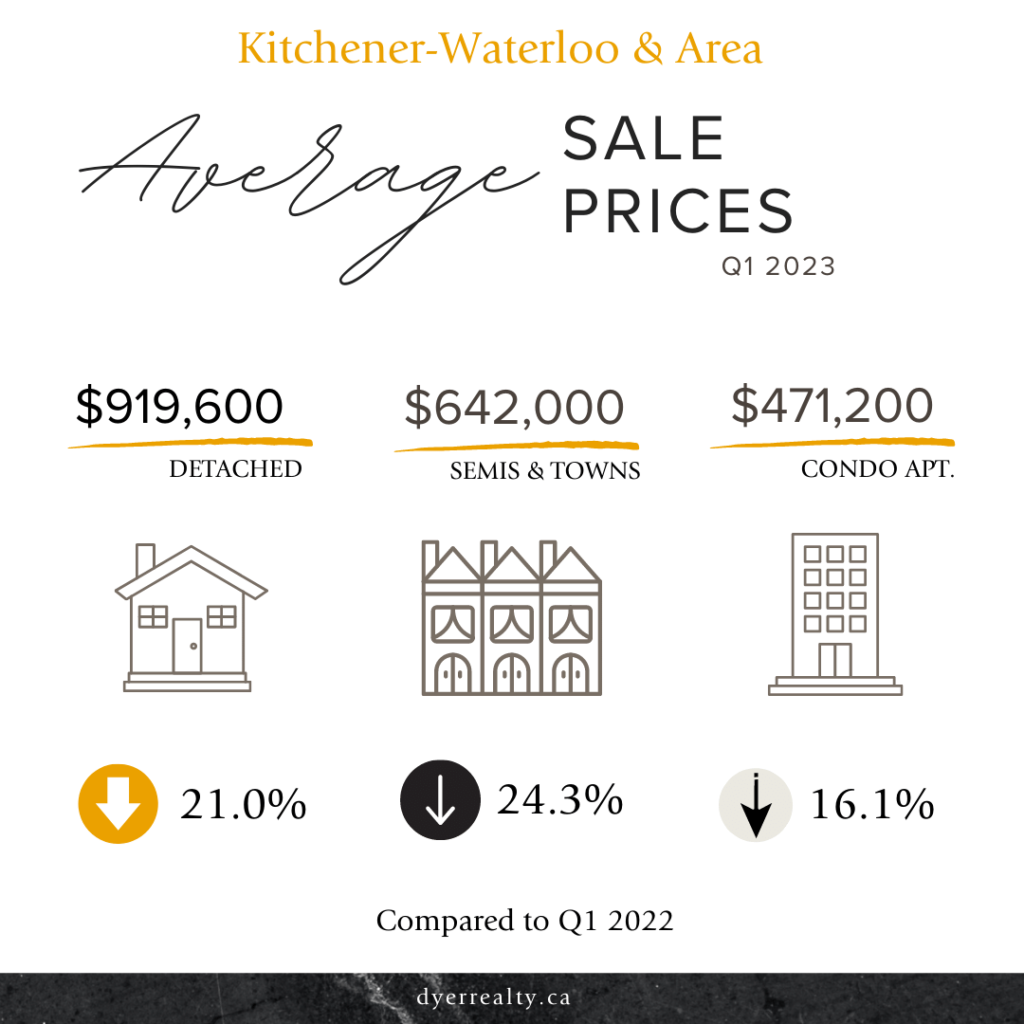
Q1 – Average Real Estate Prices
Waterloo Region average sale prices varied depending on the type of property and the location for the first quarter of 2023.
Detached homes sold for a higher amount in Kitchener-Waterloo this quarter, whereas semis and towns as well as condominium apartments fetched a higher amount in Cambridge.
Q1 – Real Estate Market Status
Looking at the number of real estate sales versus the number of active listings, we have been able to determine that Waterloo region has ended the first quarter of 2023 in a Seller’s Market.


Interest in learning more about the real estate statistics for your area?
It is true that city-wide market stats do not always directly translate to what may be happening in your neighbourhood or even on your street. That is why we strongly recommend that you contact one of our sales representatives to help you understand your specific home value.
The R.W. Dyer Realty team has over 50 years experience working with buyers and sellers helping them make informed decisions regarding real estate. If you are thinking of making a move, we would be happy to crunch the numbers in your area. Give us a call at 519-653-5353 today!
And be sure to tune into our social media channels for weekly updates on real estate statistics every Friday through our Facebook, Twitter and Instagram.
Statistics have been compiled by R.W. Dyer Realty Inc., Brokerage through the Waterloo Region Association of REALTORS®.