
R.W. Dyer Realty understands how important it is to stay on top of the market in our service areas. This is why we regularly review real estate sales and listing statistics for our service areas.
For the first quarter of 2024, home sales were all over the map in our service areas with some ending the quarter in a seller’s market, others balanced and a few favouring buyers. As we outlined in our post for the 4th quarter of 2023, the type of real estate market can help dictate a variety of factors for buyers and sellers.
- Balanced Market: When the number of homes for sale is roughly equal to the number of buyers, it’s a balanced market. Prices are stable, and neither buyers nor sellers have a significant advantage.
- Buyer’s Market: This happens when there are more houses for sale than there are buyers. Buyers have more options, so sellers may need to lower prices or offer incentives to attract buyers.
- Seller’s Market: This occurs when there are more buyers than available houses. Sellers have the upper hand, often receiving multiple offers and being able to set higher prices.
This quarter, the Dyer team has looked deeper towards sales in the following areas of Ontario:
- Cambridge
- Kitchener
- Waterloo
- Guelph
- Brantford
- Woodstock
- Paris
- Ayr
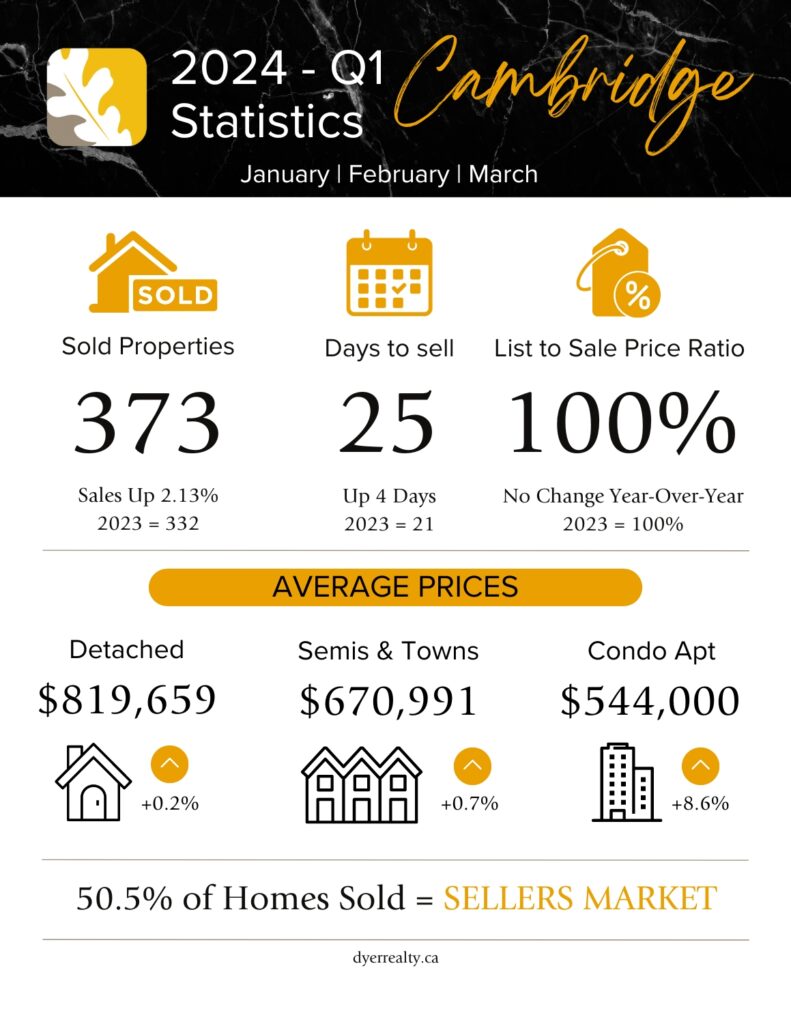
Q1 – Real Estate Statistics – Cambridge
With 50.5% of homes sold, the city of Cambridge, Ontario ended the first quarter of 2024 in a seller’s market. Cambridge and Guelph were the only two cities in our area to end the quarter this way.
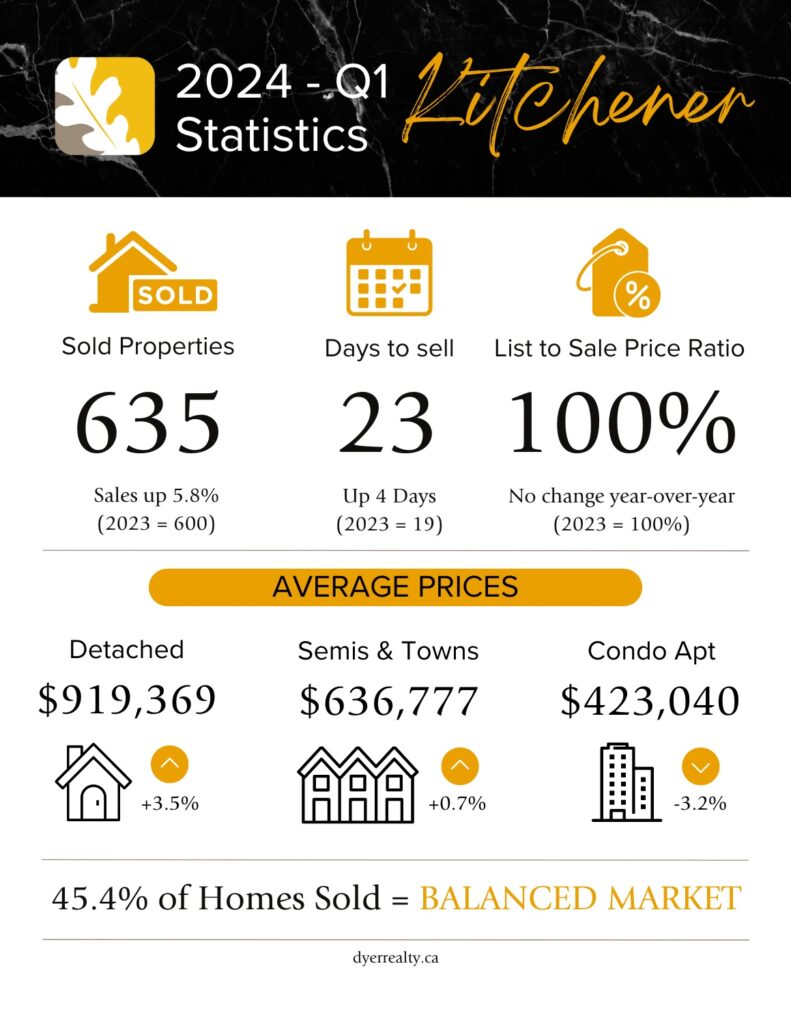
Q1 – Real Estate Statistics – Kitchener
With 45.4% of homes sold, the city of Kitchener, Ontario ended the first quarter of 2024 in a balanced real estate market.
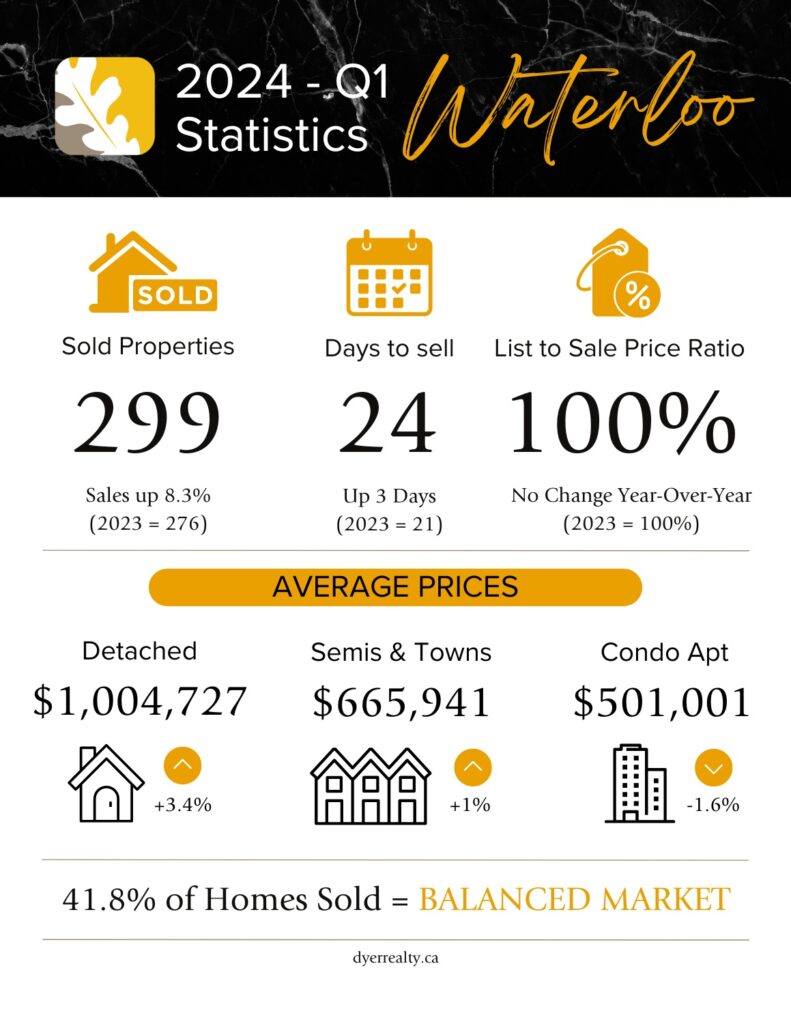
Q1 – Real Estate Statistics – Waterloo
With 41.8% of homes sold, the city of Waterloo, Ontario ended the first quarter of 2024 in a balanced real estate market.
Q1 – Real Estate Statistics – Guelph
With 52.9% of homes sold, the city of Guelph, Ontario ended the first quarter of 2024 in a seller’s real estate market.

Q1 – Real Estate Statistics – Brantford
With only 35% of homes sold, the city of Brantford, Ontario ended the first quarter of 2024 in a balanced real estate market.

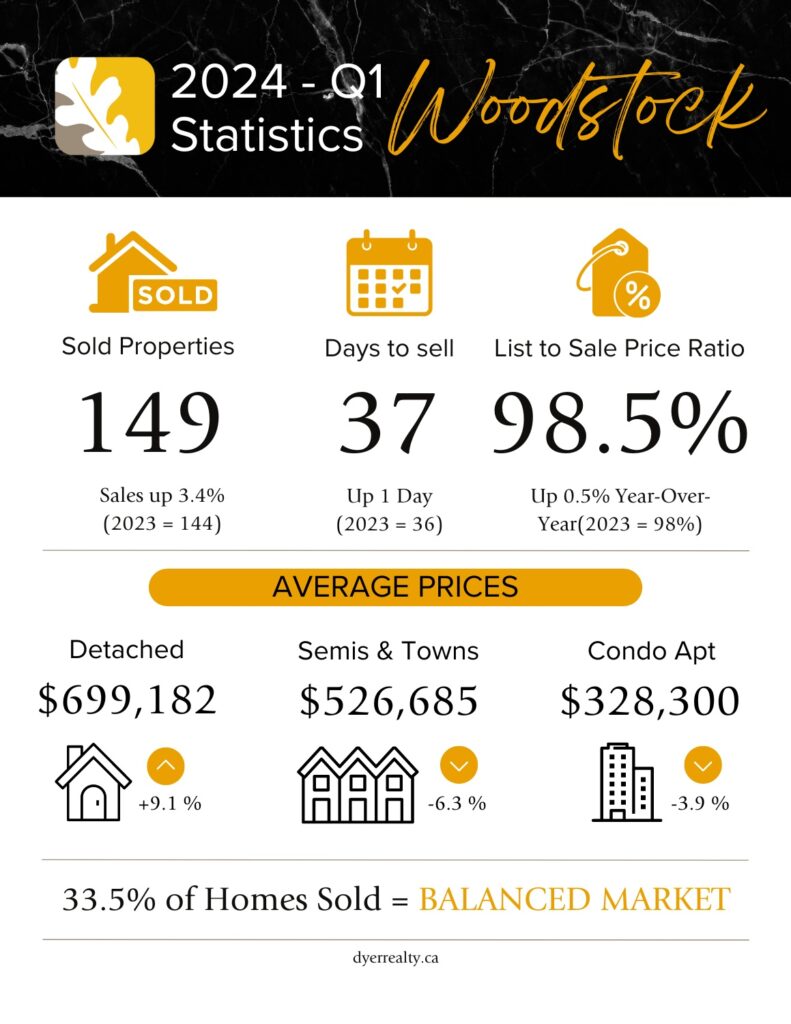
Q1 – Real Estate Statistics – Woodstock
With only 33.5% of homes sold, the city of Woodstock, Ontario ended the first quarter of 2024 in a balanced real estate market.
Q1 – Real Estate Statistics – Paris
With only 25.9% of homes sold, the town of Paris, Ontario ended the first quarter of 2024 in a buyer’s real estate market. Both Paris and Ayr were the only two areas that ended the quarter in a buyer’s market.
Q1 – Real Estate Statistics – Ayr
With only 25.7% of homes sold, the village of Ayr, Ontario ended the first quarter of 2024 in a buyer’s real estate market. Both Paris and Ayr were the only two areas that ended the quarter in a buyer’s market.
Looking to learn about the real estate market in your neighbourhood?
City-wide real estate statistics does not always translate to what is happening on your street or even in your neighbourhood. One of our sales representatives would be happy to crunch the numbers in your area and help you understand your home value. Give us a call at 519-653-5353 today!
And be sure to tune into our social media channels for weekly updates on real estate statistics every Friday through our Facebook, Twitter and Instagram pages.
Statistics have been compiled by R.W. Dyer Realty Inc., Brokerage through the Waterloo Region Association of REALTORS® Multiple Listing Service (MLS).
One comment on “2024 1st Quarter Real Estate Statistics”