
At R.W. Dyer Realty, we prioritize keeping you informed about the latest trends in our local real estate markets. In the second quarter of 2024, our service areas largely experienced a balanced market, where sale prices closely matched listing prices. Understanding whether the market favors buyers, sellers, or remains balanced can significantly impact your real estate decisions.
- Balanced Market: When the number of homes for sale is roughly equal to the number of buyers, it’s a balanced market. Prices are stable, and neither buyers nor sellers have a significant advantage.
- Buyer’s Market: This happens when there are more houses for sale than there are buyers. Buyers have more options, so sellers may need to lower prices or offer incentives to attract buyers.
- Seller’s Market: This occurs when there are more buyers than available houses. Sellers have the upper hand, often receiving multiple offers and being able to set higher prices.
This quarter, the Dyer team has looked deeper towards sales in the following areas of Ontario:
- Cambridge
- Kitchener
- Waterloo
- Guelph
- Brantford
- Woodstock
- Paris
- Ayr
- Stratford
Click here if you would like to review real estate statistics from the 1st quarter of 2024, and click here to review the statistics from the same period in 2023.
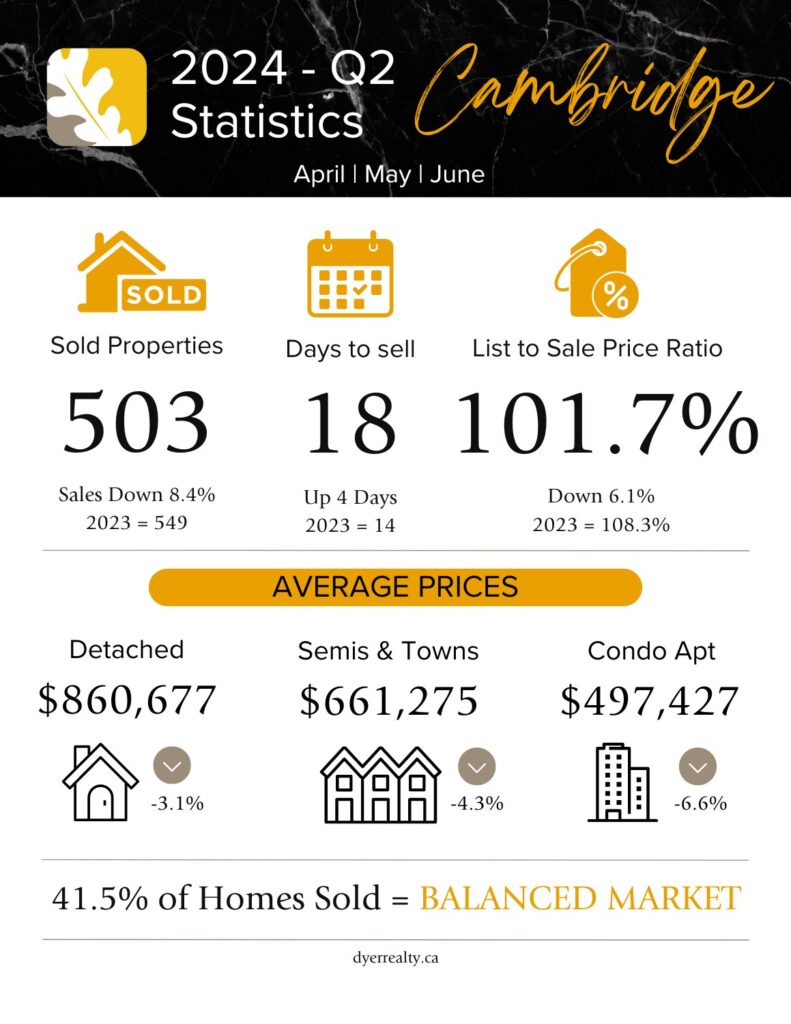
Q2 – Real Estate Statistics – Cambridge
With 41.5% of homes sold, the city of Cambridge, Ontario ended the second quarter of 2024 in a balanced market.
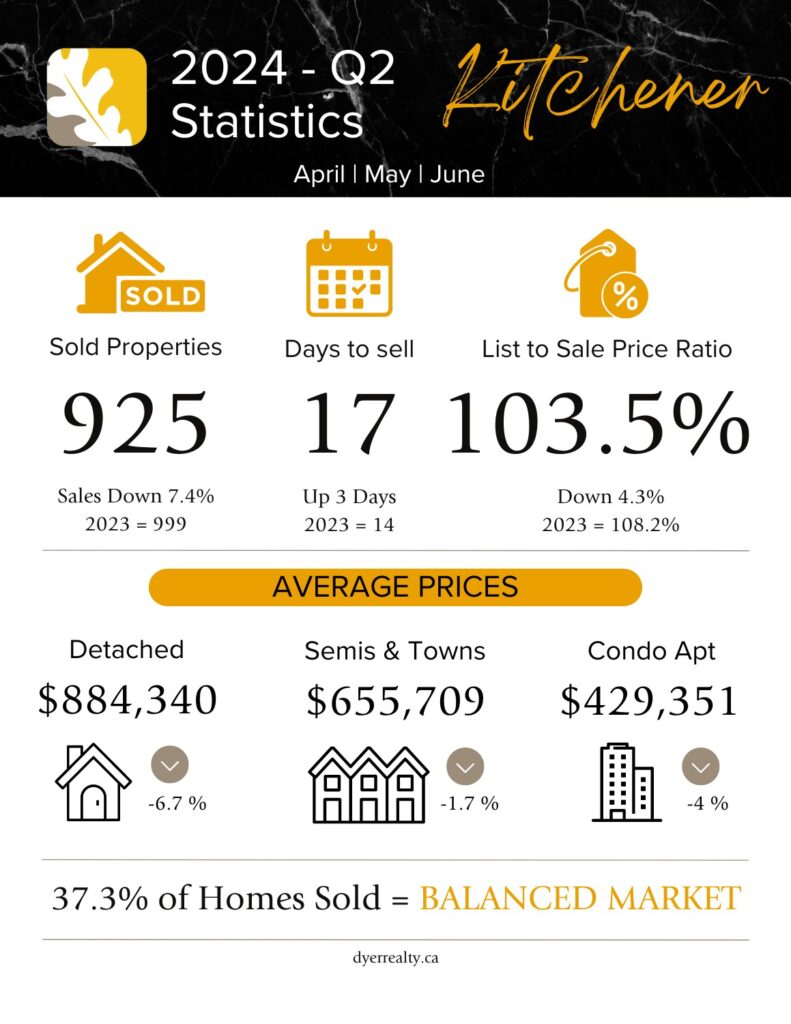
Q1 – Real Estate Statistics – Kitchener
With 37.3% of homes sold, the city of Kitchener, Ontario ended the second quarter of 2024 in a balanced real estate market. Kitchener had the highest variation from the listing price to the sale price with a ratio of 103.5%.
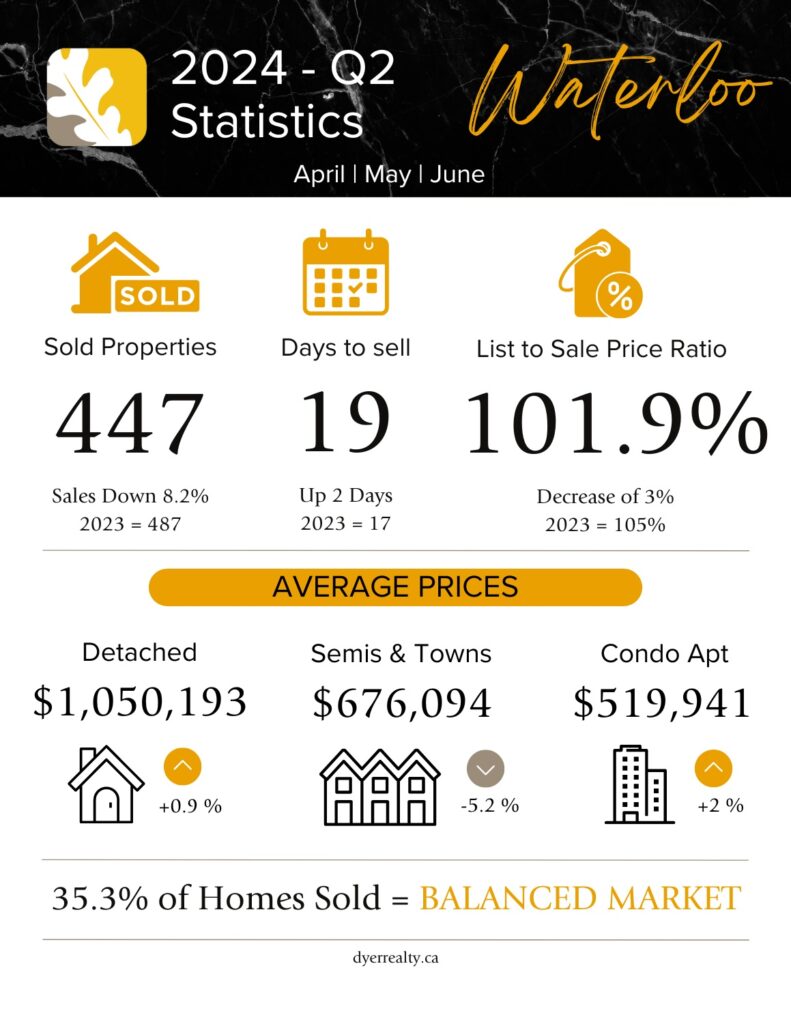
Q2 – Real Estate Statistics – Waterloo
With 35.3% of homes sold, the city of Waterloo, Ontario ended the second quarter of 2024 in a balanced real estate market. Waterloo had the highest average sale price for a detached home this quarter.
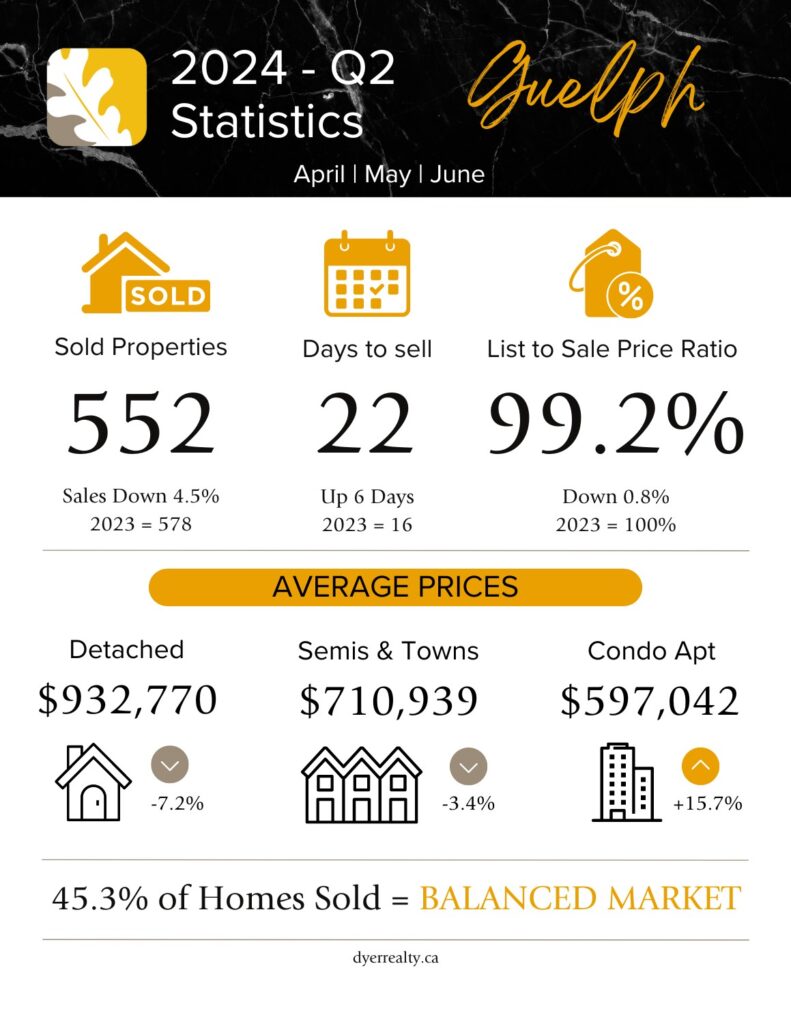
Q2 – Real Estate Statistics – Guelph
With 45.3% of homes sold, the city of Guelph, Ontario ended the second quarter of 2024 in a seller’s real estate market.
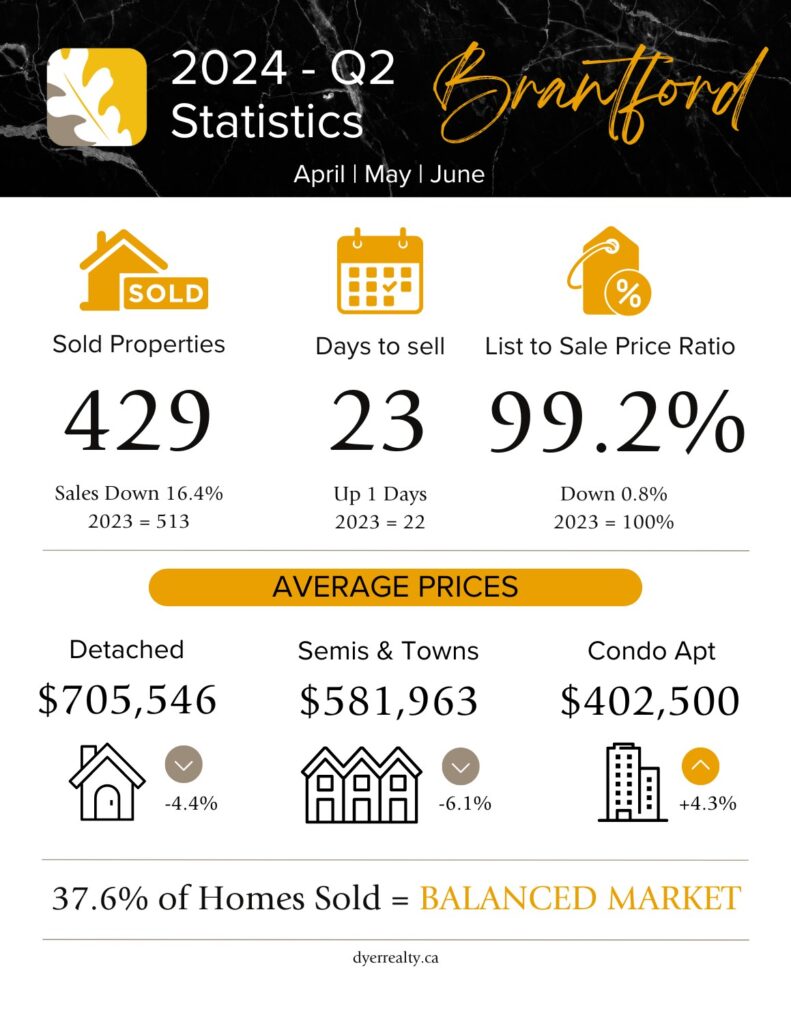
Q2 – Real Estate Statistics – Brantford
With only 37.6% of homes sold, the city of Brantford, Ontario ended the second quarter of 2024 in a balanced real estate market.
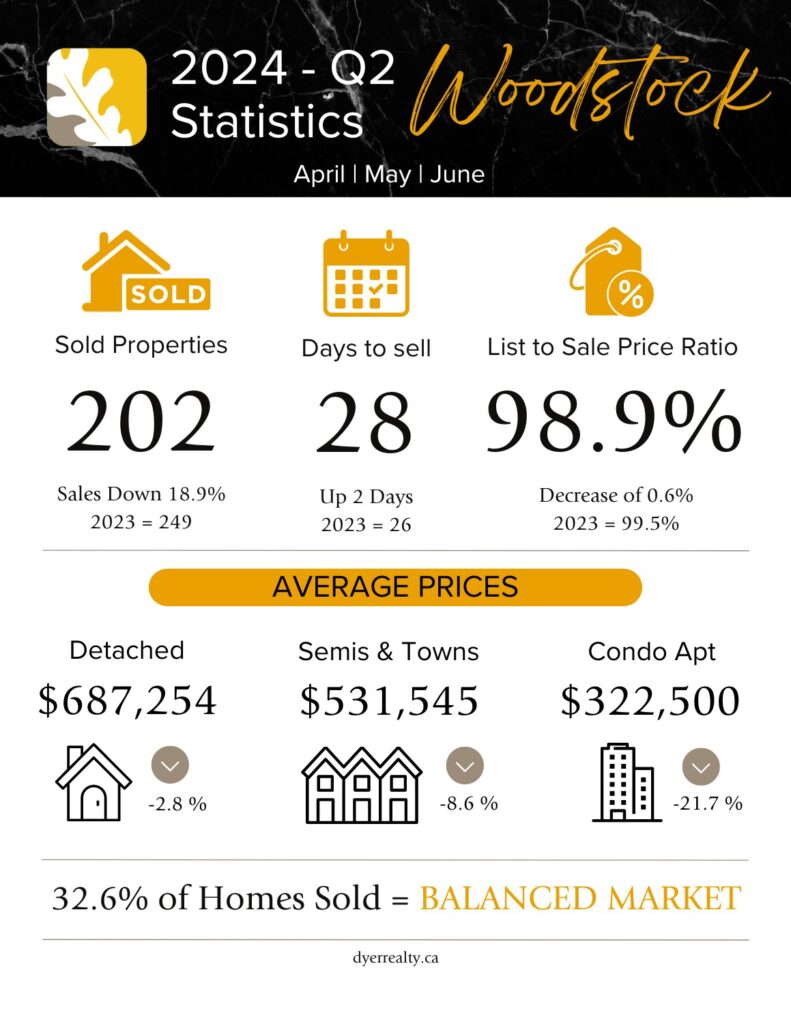
Q1 – Real Estate Statistics – Woodstock
With only 32.6% of homes sold, the city of Woodstock, Ontario ended the second quarter of 2024 in a balanced real estate market.
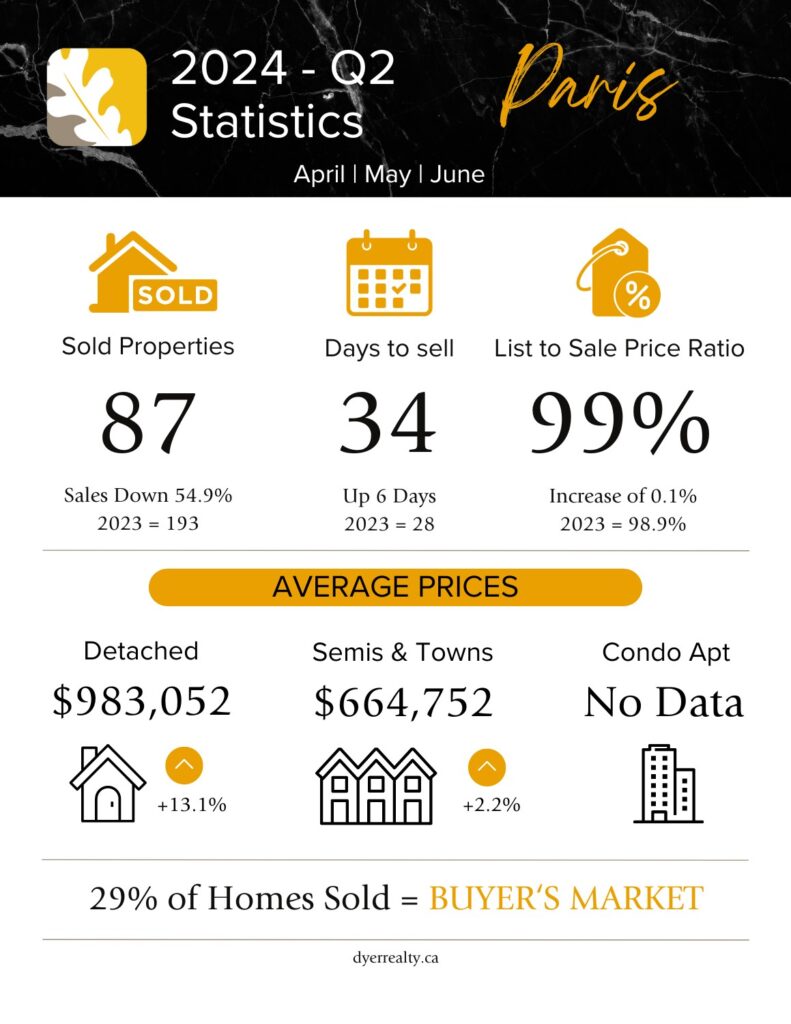
Q2 – Real Estate Statistics – Paris
With only 29% of homes sold, the town of Paris, Ontario ended the second quarter of 2024 in a buyer’s real estate market. Paris is the only area to be in a buyer’s market for this quarter.
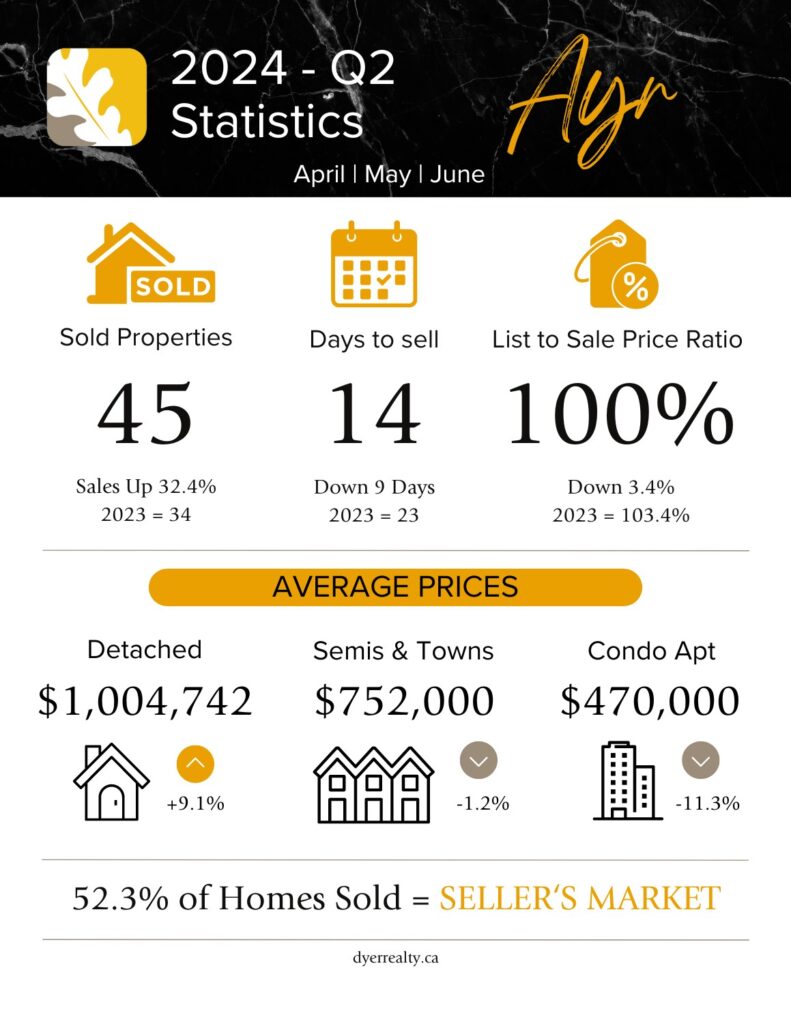
Q2 – Real Estate Statistics – Ayr
With 52.3% of homes sold, the village of Ayr, Ontario ended the second quarter of 2024 in a seller’s real estate market. This is a positive change compared to the 1st quarter of 2024 and Ayr is the only area that ended the quarter favouring seller’s. Also, the average home in Ayr sold faster than all other areas we reviewed this quarter.
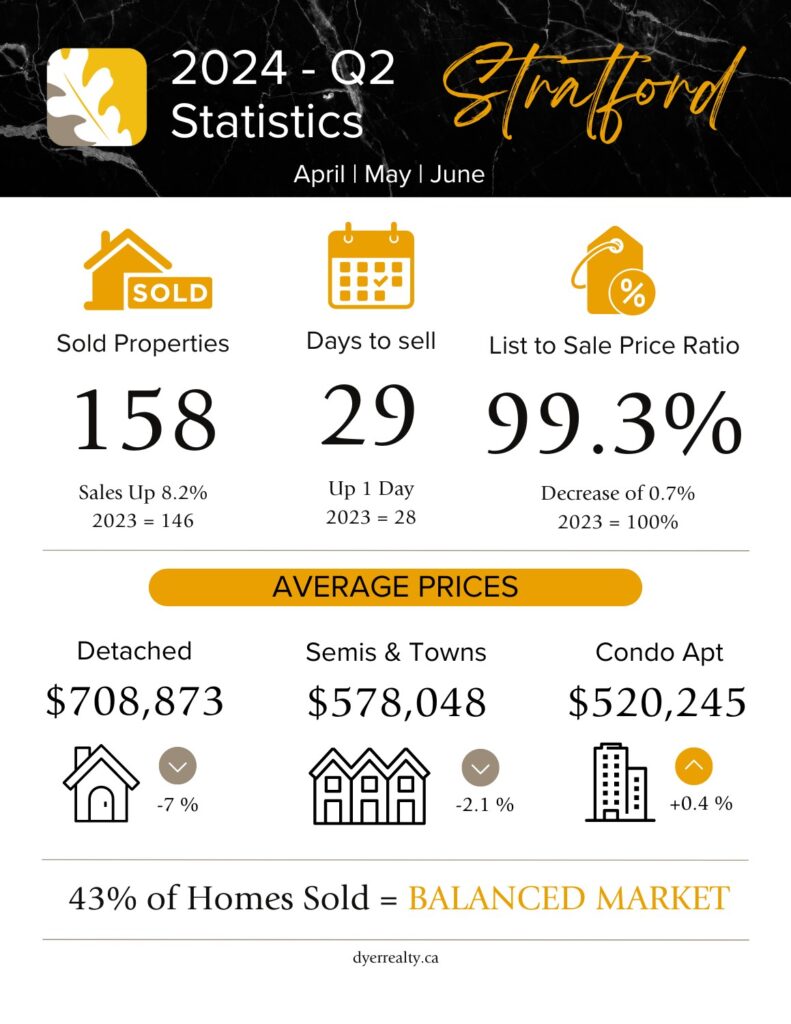
Q2 – Real Estate Statistics – Stratford
With 43% of homes sold, the town of Stratford, Ontario ended the second quarter of 2024 in a balanced real estate market.
Looking to learn about the real estate market in your neighbourhood?
City-wide real estate statistics does not always translate to what is happening in your neighbourhood or style of home. One of our sales representatives would be happy to crunch the numbers in your area and help you understand your home value. Give us a call at 519-653-5353 today!
And be sure to tune into our social media channels for weekly updates on real estate statistics every Friday through our Facebook, Twitter and Instagram pages.
Statistics have been compiled by R.W. Dyer Realty Inc., Brokerage through the Cornerstone Association of REALTORS® Multiple Listing Service (MLS).
One comment on “2024 Second Quarter Real Estate Statistics”