
At R.W. Dyer Realty, we want you to stay informed about the latest trends in our local real estate markets. In the third quarter of 2024, the urban centres in our service area found themselves on the low end of a balanced market, where sale prices closely matched listing prices. As soon as you left the city however, a buyer’s market prevailed. Understanding whether the market favors buyers, sellers, or remains balanced can significantly impact your real estate decisions.
- Balanced Market: When the number of homes for sale is roughly equal to the number of buyers, it’s a balanced market. Prices are stable, and neither buyers nor sellers have a significant advantage.
- Buyer’s Market: This happens when there are more houses for sale than there are buyers. Buyers have more options, so sellers may need to lower prices or offer incentives to attract buyers.
- Seller’s Market: This occurs when there are more buyers than available houses. Sellers have the upper hand, often receiving multiple offers and being able to set higher prices.
This quarter, the Dyer team has looked deeper towards sales in the following areas of Ontario:
- Cambridge
- Kitchener
- Waterloo
- Guelph
- Brantford
- Woodstock
- Paris
- Ayr
- Stratford
Click here to review statistics from the 2nd quarter of 2024 or click here if you would like to review real estate statistics from the 1st quarter.
Interested in what the statistics looked like for the 3rd quarter of 2023 – click here.
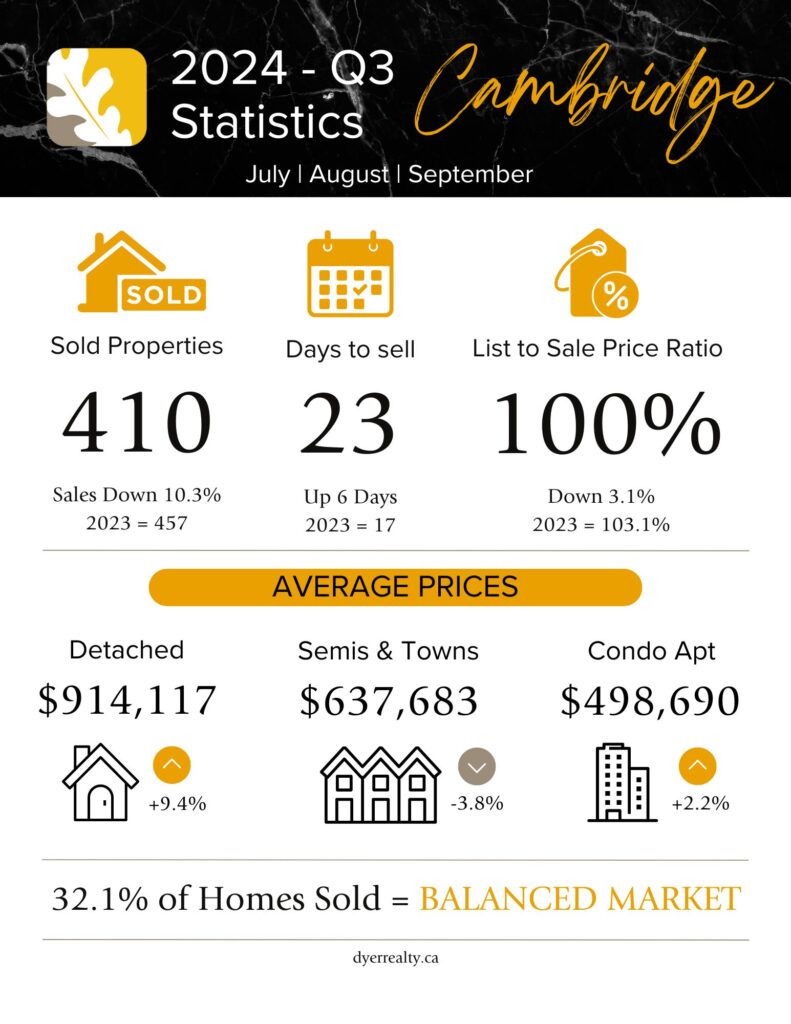
Q3 – Real Estate Statistics – Cambridge
With 32.1% of homes sold, the city of Cambridge, Ontario ended the third quarter of 2024 on the lower side of a balanced market. The average sale price for a detached home in Cambridge saw an increase this quarter, as did apartment style condominiums.
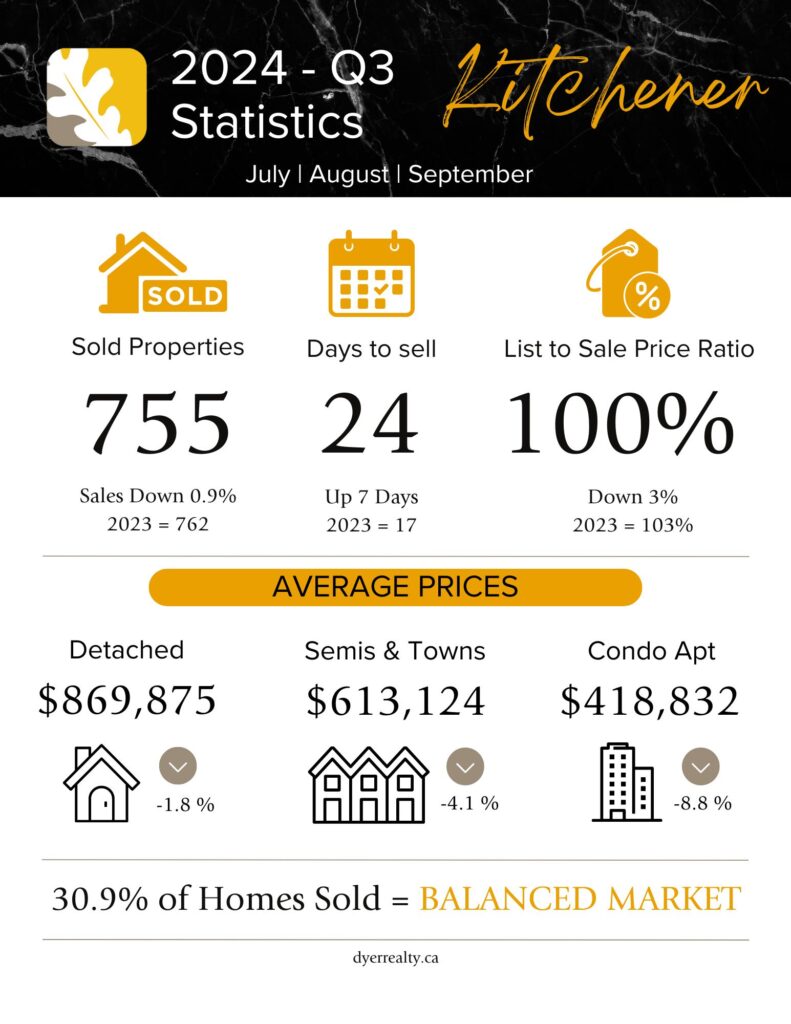
Q3 – Real Estate Statistics – Kitchener
With 30.9% of homes sold, the city of Kitchener, Ontario also ended the third quarter of 2024 on the low end of a balanced real estate market. Year-over-year, each residential real estate type saw a reduction in sales prices this quarter as well.
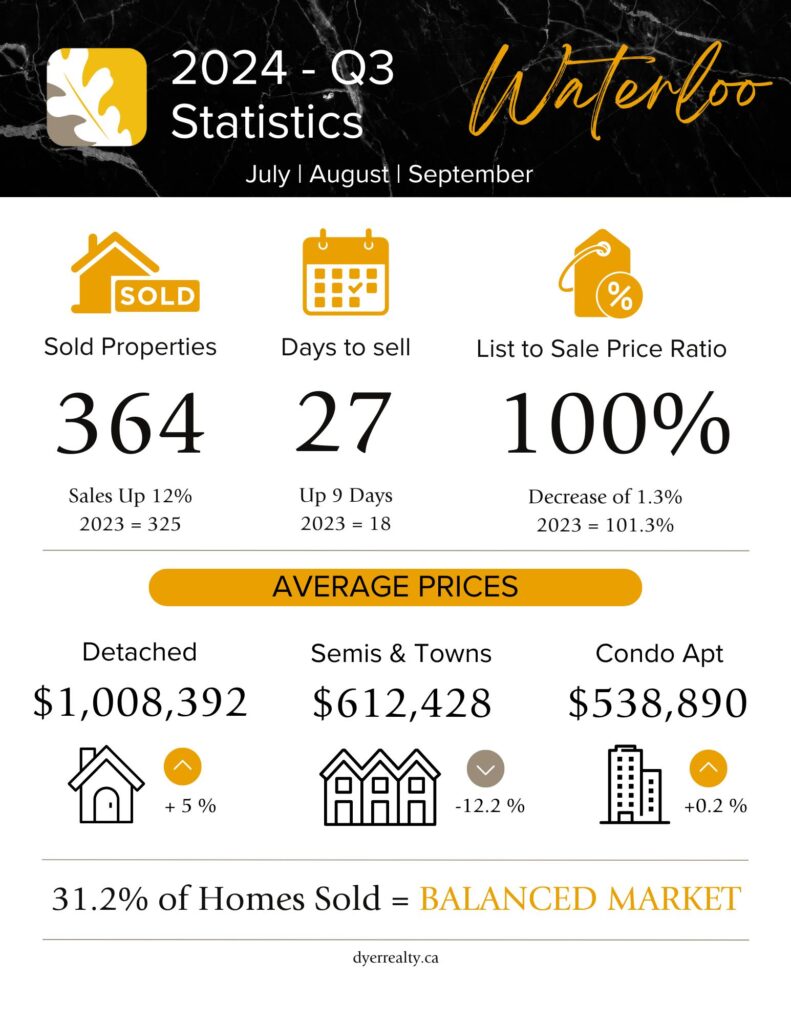
Q3 – Real Estate Statistics – Waterloo
With 31.2% of homes sold, the city of Waterloo, Ontario ended the third quarter of 2024 in a balanced real estate market. Yet again, Waterloo had the highest average sale price for a detached home this quarter.
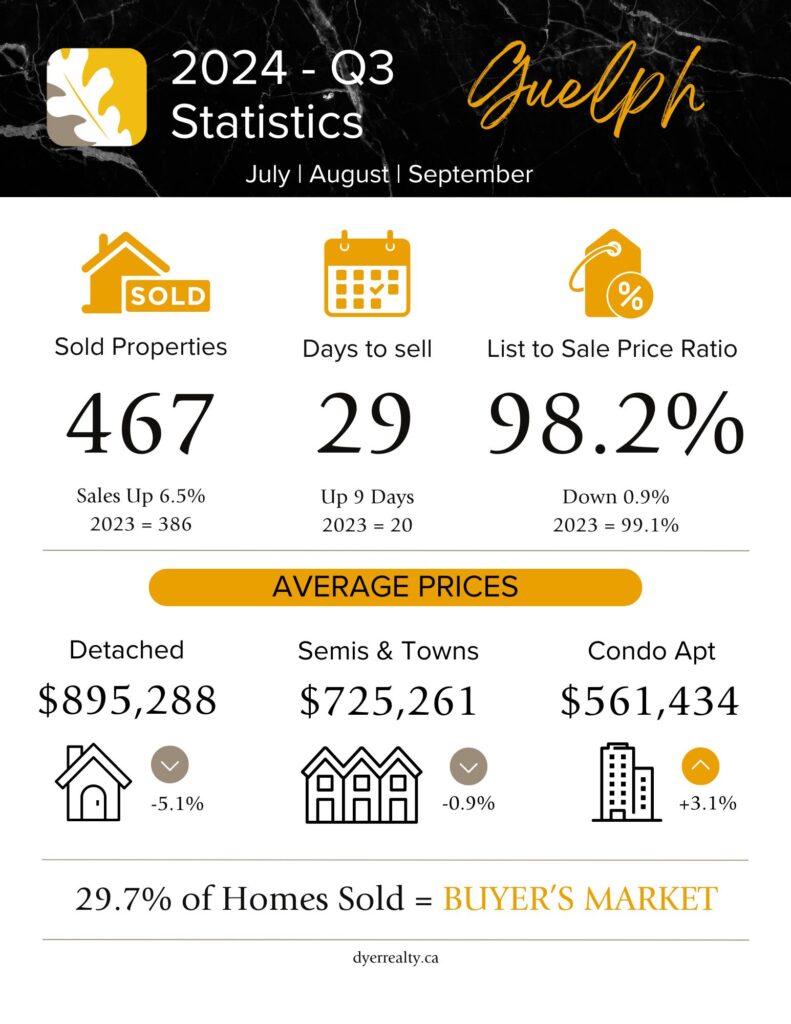
Q3 – Real Estate Statistics – Guelph
With 29.7% of homes sold, the city of Guelph, Ontario slipped into a Buyer’s Market to end the third quarter of 2024. Detached listings as well as semis & towns all saw a drop in the average price compared to the same period of 2023. Condo Apartments did see an increase however.
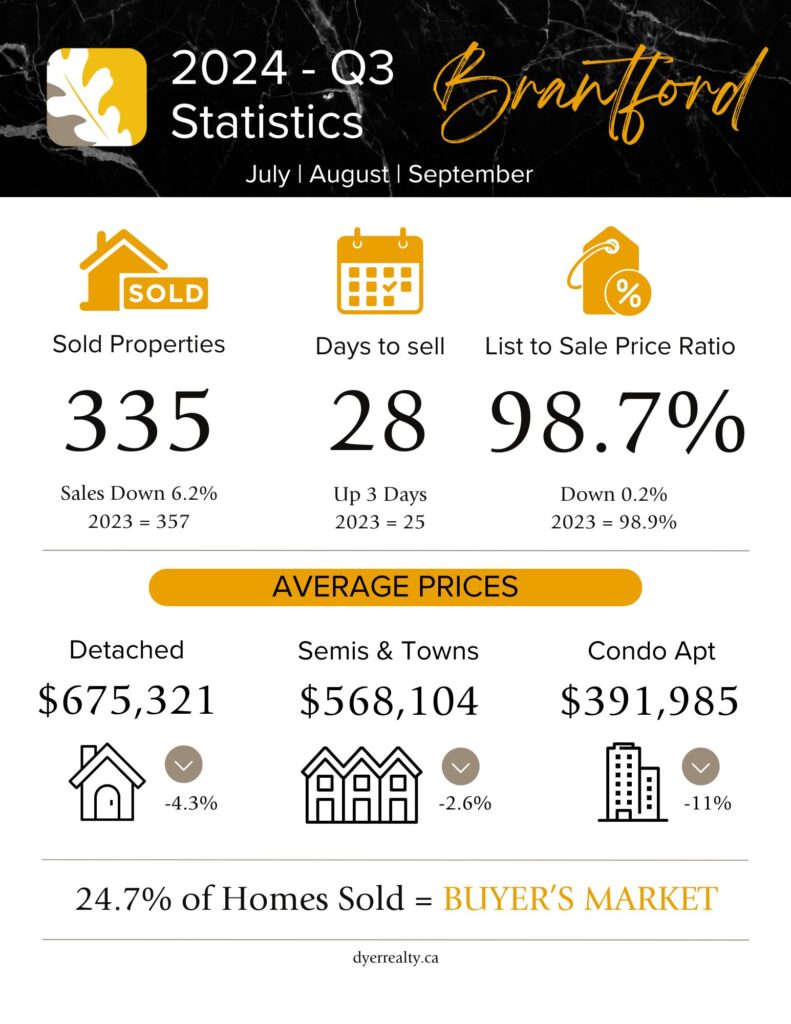
Q3 – Real Estate Statistics – Brantford
With only 24.7% of homes sold, the city of Brantford, Ontario ended the second quarter of 2024 in a buyer’s real estate market.
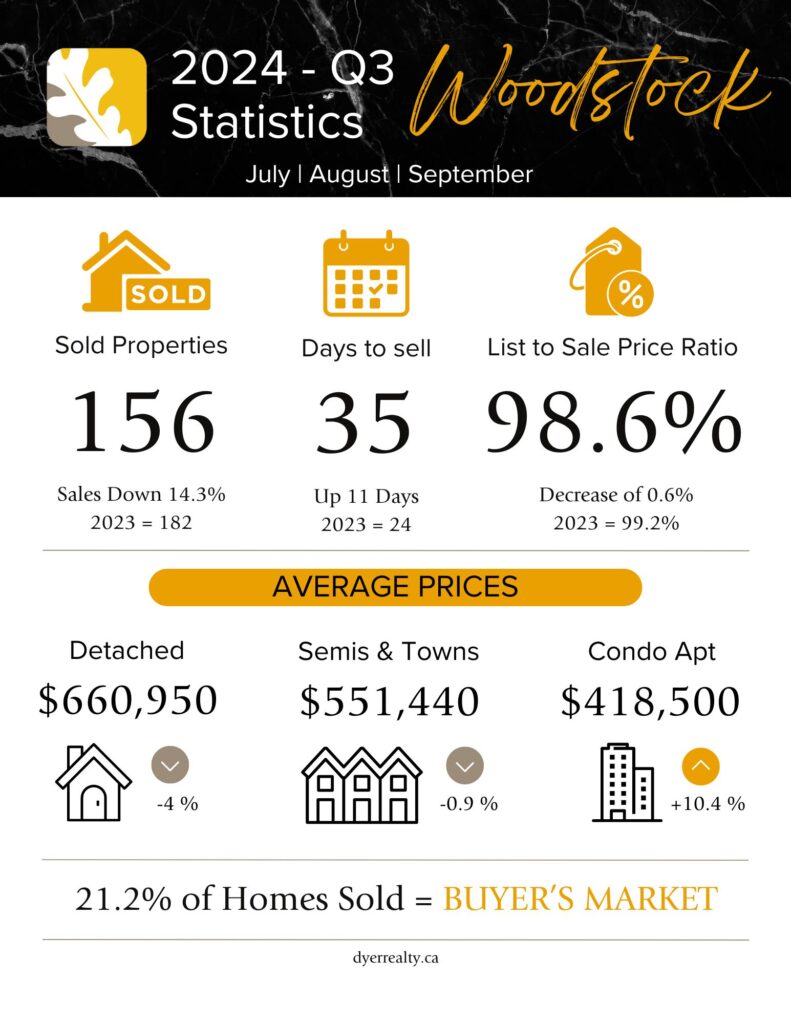
Q3 – Real Estate Statistics – Woodstock
With only 21.2% of homes sold, the city of Woodstock, Ontario ended the second quarter of 2024 in a buyer’s real estate market. Condo Apartments saw an increase in average sale price year over year which was a positive for sellers this quarter.
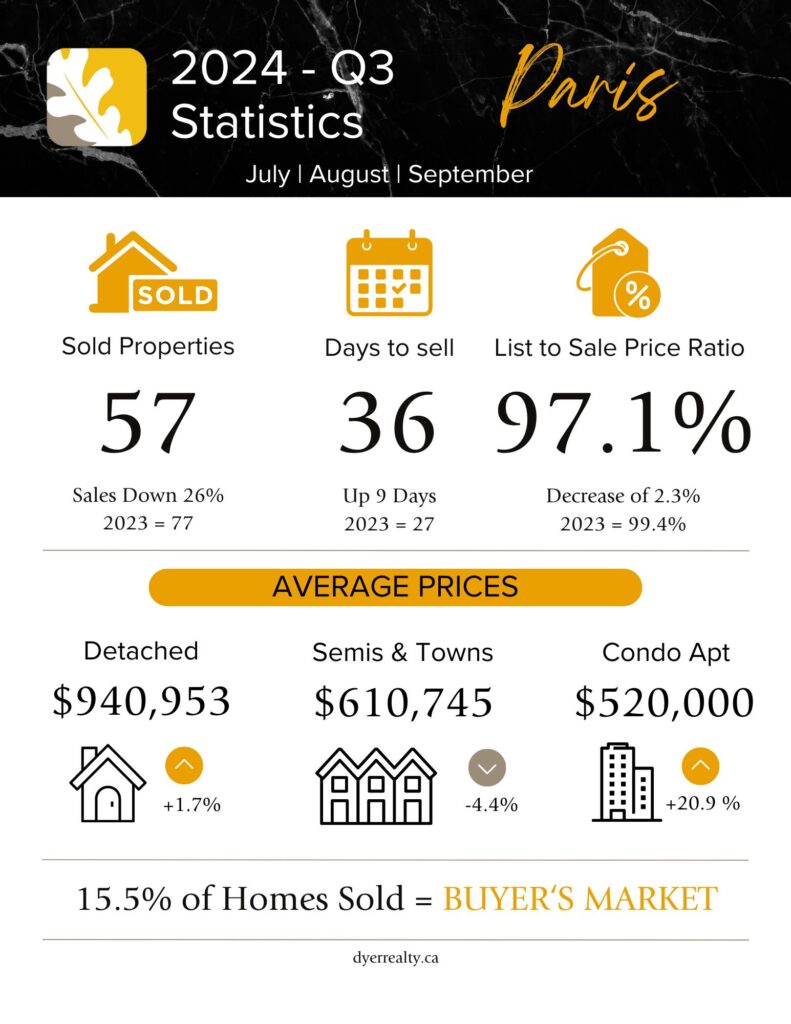
Q3 – Real Estate Statistics – Paris
With a low 15.5% of homes sold, the town of Paris, Ontario once again ended the third quarter of 2024 in a buyer’s real estate market. There was an increase in average prices for detached properties and condo apartments, however semi-detached properties and townhouses had a decrease.
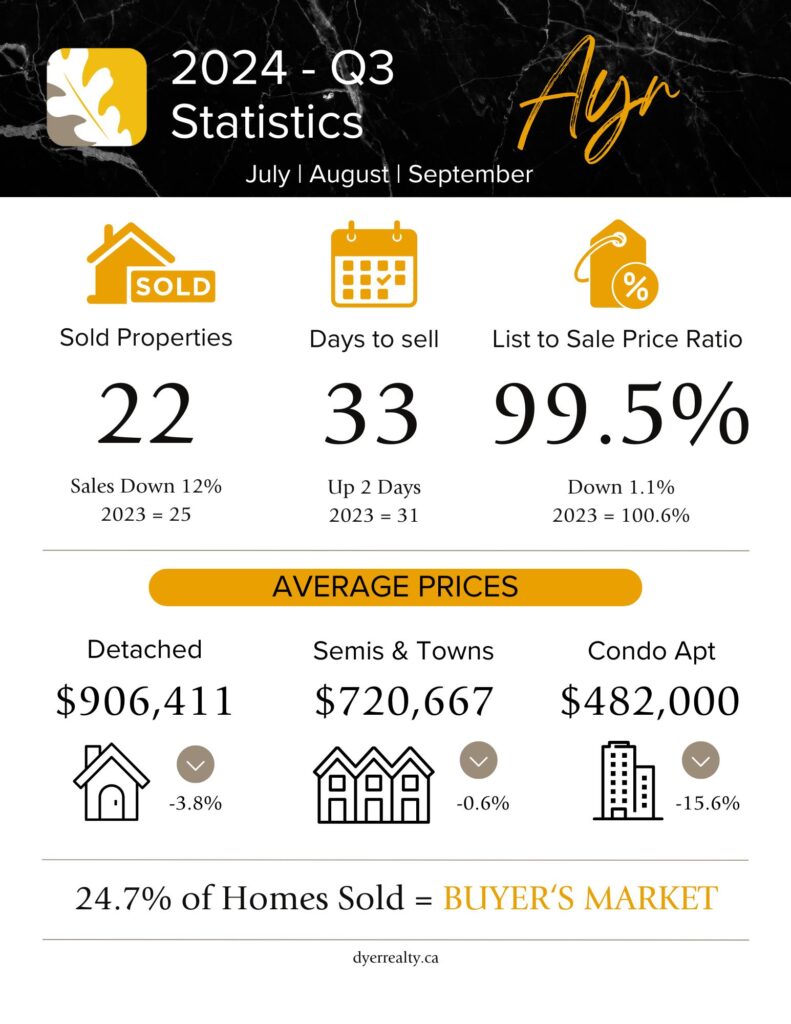
Q3 – Real Estate Statistics – Ayr
With 24.7% of homes sold, the village of Ayr, Ontario ended the third quarter of 2024 in a buyer’s real estate market. In comparison the second quarter, this is a large drop as the town was firmly in the seller’s market in Q2.
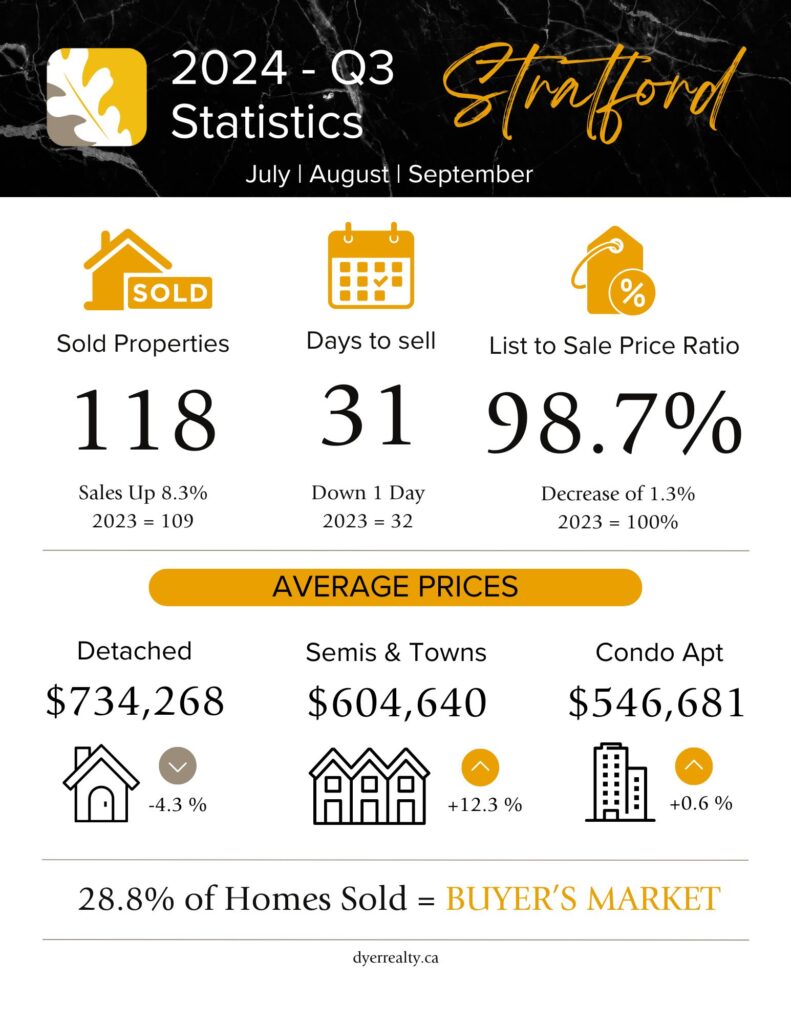
Q3 – Real Estate Statistics – Stratford
With only 28.8% of homes sold, the town of Stratford, Ontario also ended the third quarter of 2024 in a buyer’s real estate market.
Looking to learn about the real estate market in your neighbourhood?
City-wide real estate statistics does not always translate to what is happening in your neighbourhood or style of home. One of our sales representatives would be happy to crunch the numbers in your area and help you understand your home value. Give us a call at 519-653-5353 today!
And be sure to tune into our social media channels for weekly updates on real estate statistics every Friday through our Facebook, Twitter and Instagram pages.
Statistics have been compiled by R.W. Dyer Realty Inc., Brokerage through the Cornerstone Association of REALTORS® Multiple Listing Service (MLS).