
The 3rd quarter of 2021 was all about supply and demand for real estate statistics in Kitchener-Waterloo, Cambridge, Brantford, Guelph and Woodstock. Lower than average inventory has had an affect on the number of sales as well as an increase in average sales prices.
We do understand that lockdowns early in 2020 due to the pandemic helped push many homeowners to hold off selling their properties until the fall.
With thanks to help from the Cambridge Association of REALTORS® Multiple Listings System, the team here at R.W. Dyer Realty has been able to compare and contrast real estate statistics in our local area.
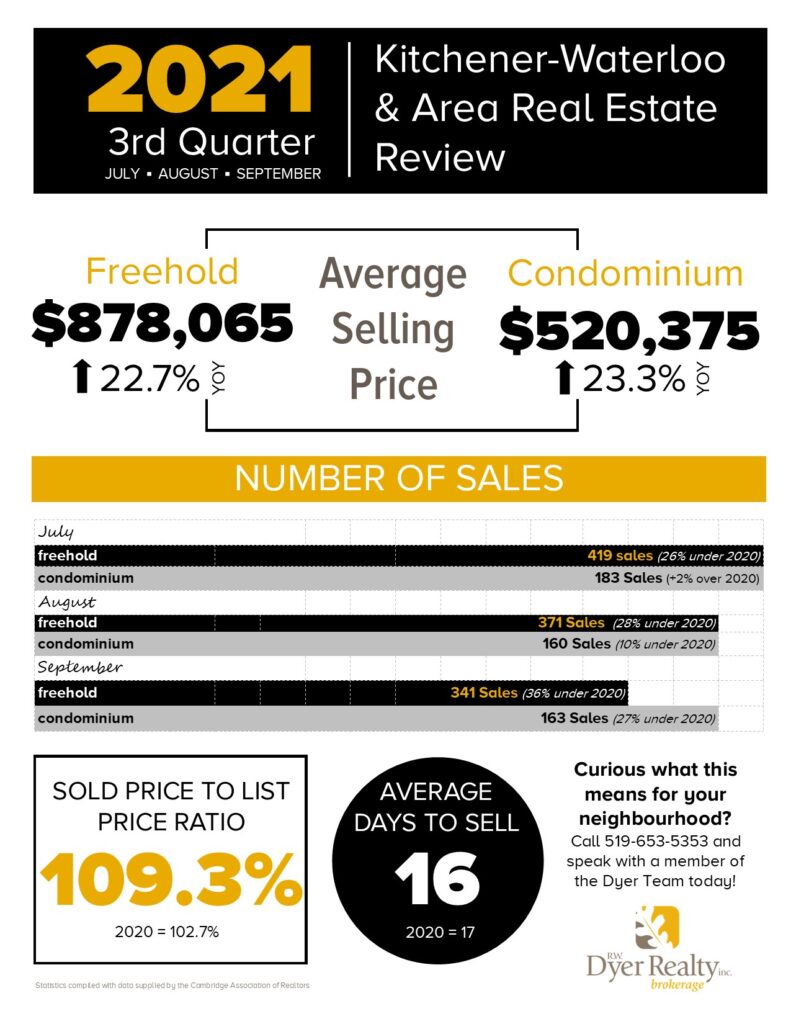
Kitchener-Waterloo and Area Real Estate Statistics
Real estate statistics in the Kitchener-Waterloo has seen average prices reaching record highs with freehold homes being up over 20% compared to the year before. Residential real estate took a little longer to sell in this quarter at 16 days but the list to sale price ratio was still strong with the average home selling for almost 10% more than the list price.
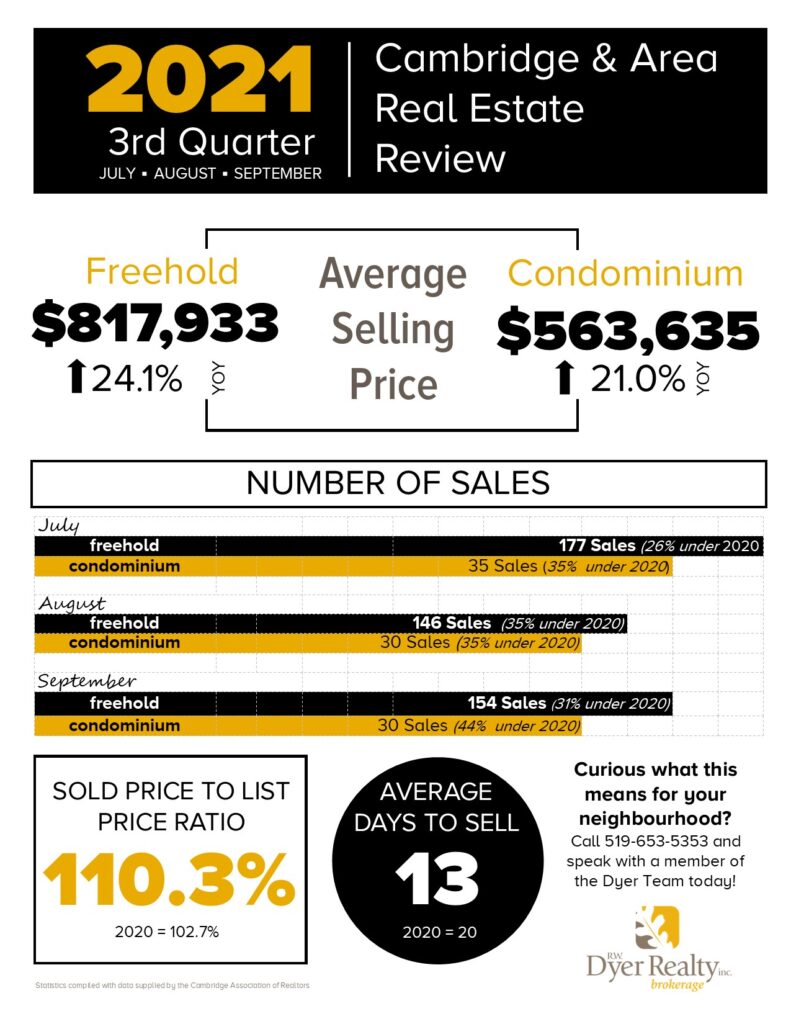
Cambridge and Area Real Estate Statistics
The Cambridge real estate statistics are similar to Kitchener-Waterloo with regards to the average sale price increasing and how properties sold for over the listing price. The number of sales decreased every month this quarter as well. Homes in Cambridge sold in less than two weeks which is a few days faster on average than in Kitchener-Waterloo.
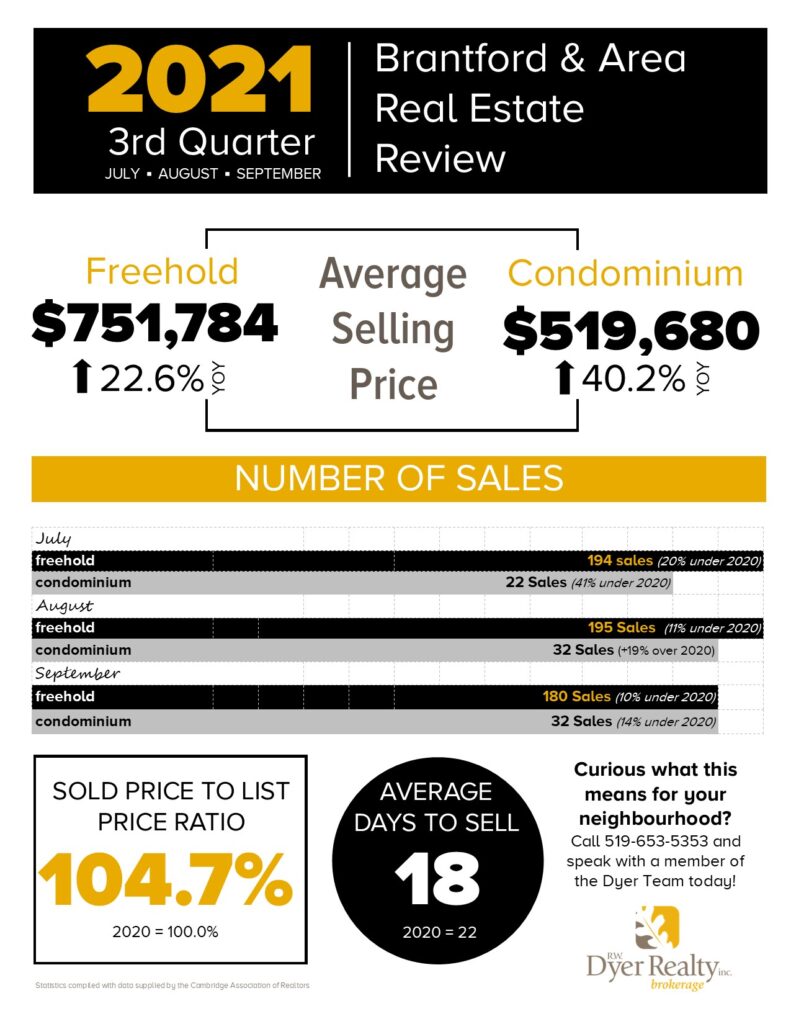
Brantford and Area Real Estate Statistics
Real estate statistics in the Brantford area saw some significant increases in the average sale price – especially in the condo market which saw an increase of just over 40% compared to the same period last year. At 18 days to sell on average, homes took a little longer than in Cambridge and Kitchener-Waterloo, however this is still a step in the right direction compared to 2020.
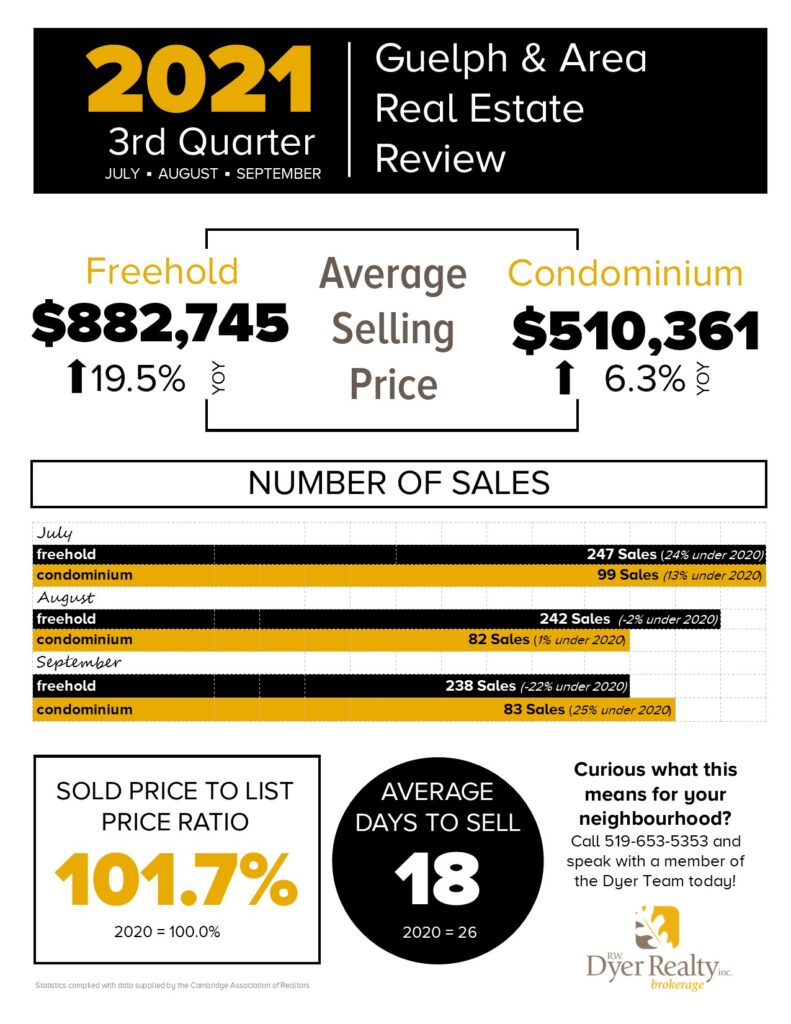
Guelph and Area Real Estate Statistics
The Guelph area saw the highest average sales prices in the area with the average freehold home selling for over $880,000. Traditionally a strong condo market, the Guelph area has only seen a 6% increase in average prices, which is much different than the other areas in our research. On average homes sold in this area within 18 days and for 1.7% higher than the listing price.
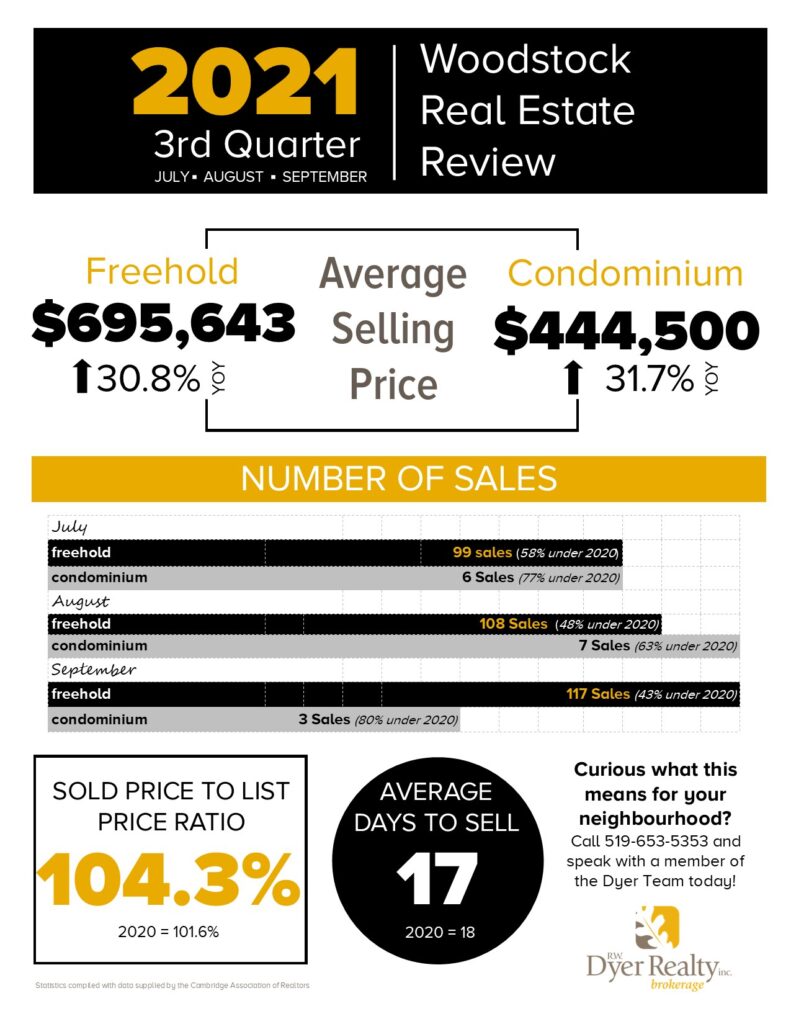
Woodstock and Area Real Estate Statistics
Real estate in the Woodstock area traditionally has lower statistics compared to some other areas on our list but they have still seen some strong increases in average prices this quarter. For number of sales, both Freehold and Condo properties had a decrease every month compared to 2020. At 17 days on average to sell, and with homes sell for 4.3% higher than the asking price, Woodstock is still a strong area for residential real estate.
Looking for more statistics?
Weekly updates are shared on our Facebook, Twitter and Instagram accounts every Friday to cover what has been happening in Waterloo Region real estate over the past 7 days. This report gives an up-to-date way to track the number of new listings have come to the market, how many properties have sold, what the average sale price was and how many days it took to sell.
On top of the weekly and quarterly update, the team at R.W. Dyer Realty would love to help you understand how real estate is selling in your specific neighbourhood and for your style of home. Reach out to your favourite sales representative or give us a call at 519.653.5353 and ask to speak with a REALTOR today!
2 comments on “Real Estate Statistics – 2021 3rd Quarter Review”